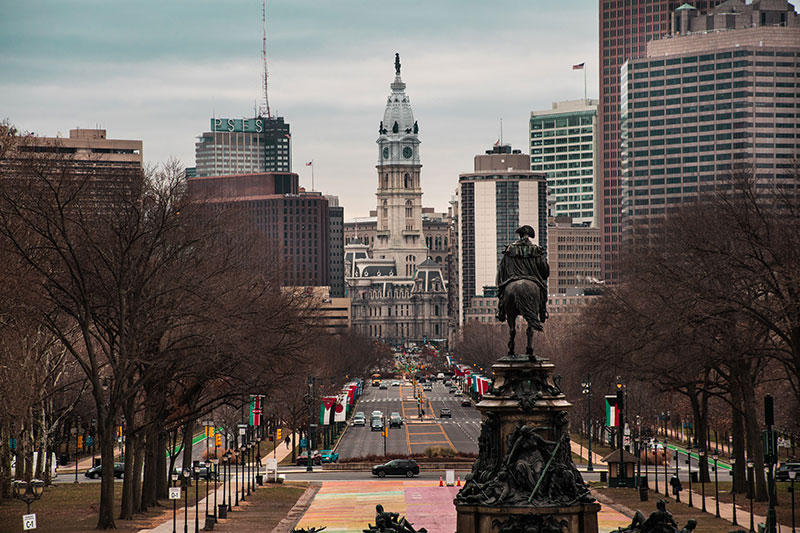
Philadelphia is one of the most historic cities in the United States and is the place where the Declaration of Independence and Constitution was signed. It is rich in history and culture and an extremely worthwhile place to explore.
However, violence in certain parts of the city is an everyday occurrence. Philadelphia has safe areas as well as dangerous parts. And anywhere you go, you’d be well-advised to know where to stay, as well as areas to avoid.
Is Philadelphia Safe To Visit?
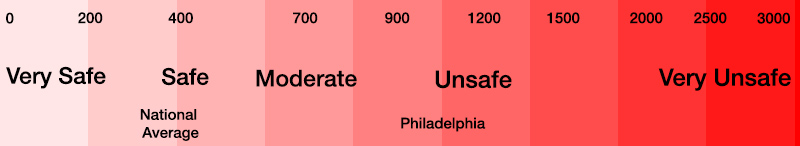
Statistically speaking, Philadelphia is a slightly unsafe place to visit. In 2021, Philadelphia had a violent crime rate of 936.09 per 100,000 people. It’s violent crime rate is on par with cities like Houston, Washington D.C. and Chicago.
In 2021, Philadelphia reported 551 homicides and had a homicide rate of 34.36 per 100,000 people and had one of the highest murder rates in the country.
Year over year murder has increased by 11.5%.
Philadelphia’s murder rate is 5.3x greater than the national average.
Philadelphia’s murder rate is 4.4x greater than the state average.
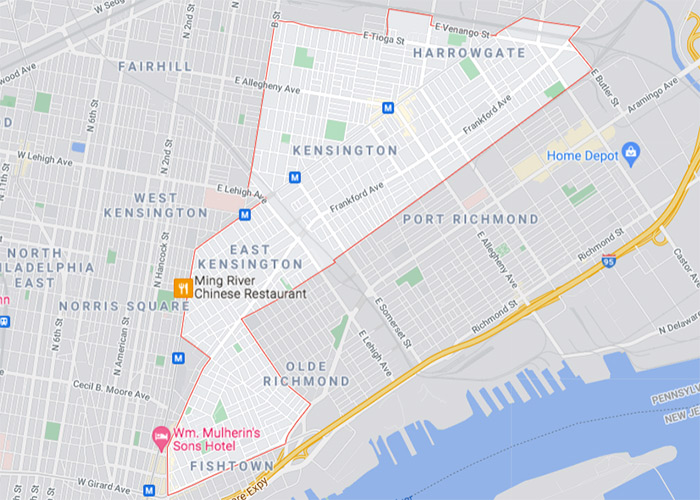
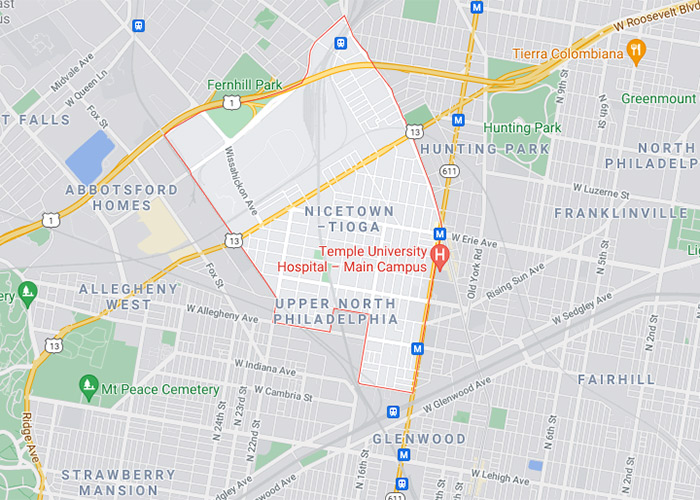
When visiting or moving to Philadelphia, there should be certain areas that you should avoid at all costs. Unless you’re a previous resident or know your way around the streets, we wouldn’t recommend wandering into these areas. You want to avoid these areas at night especially:
Kensington/Juniata Park
Nicetown
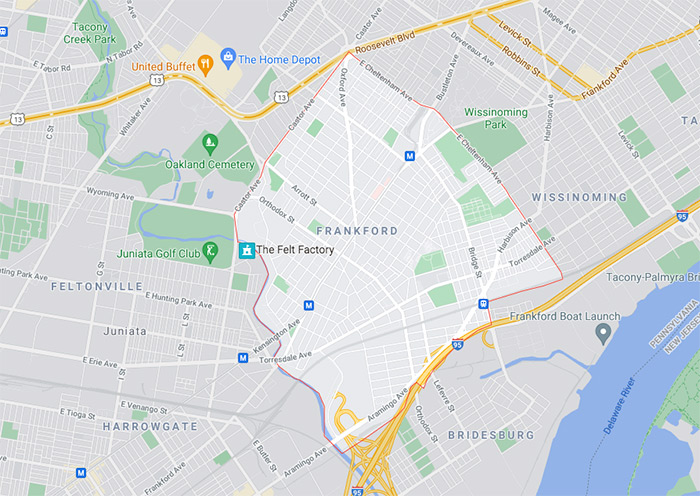
Frankford
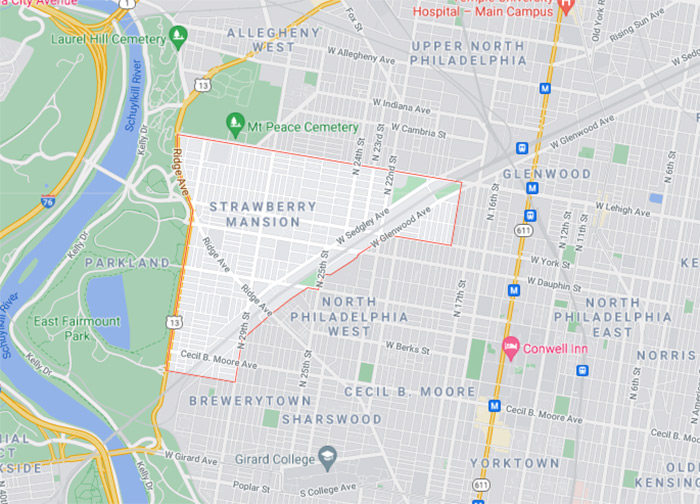
Strawberry Mansion
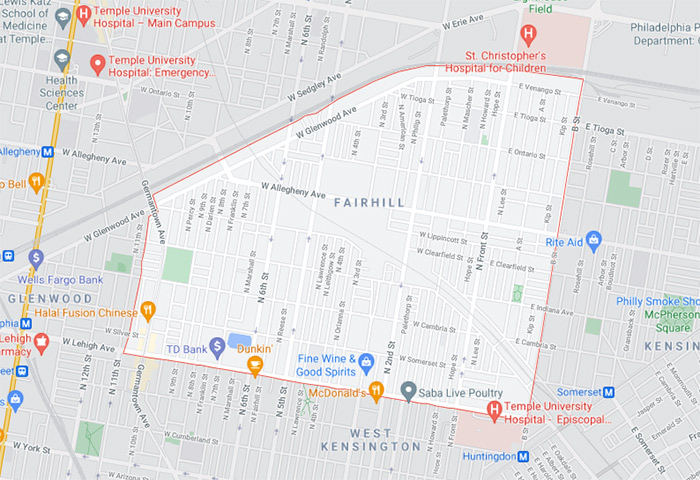
Fairhill
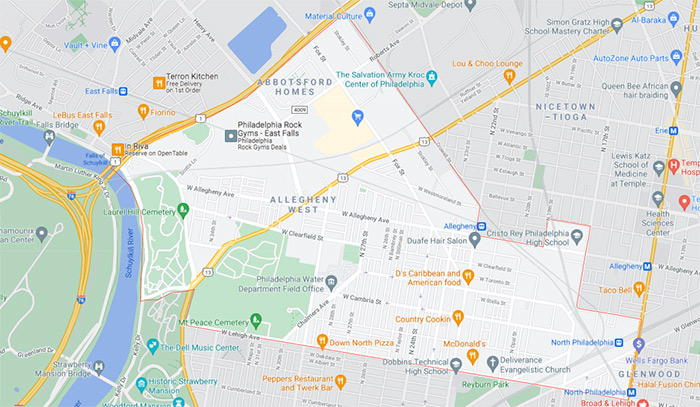
Alleghany West
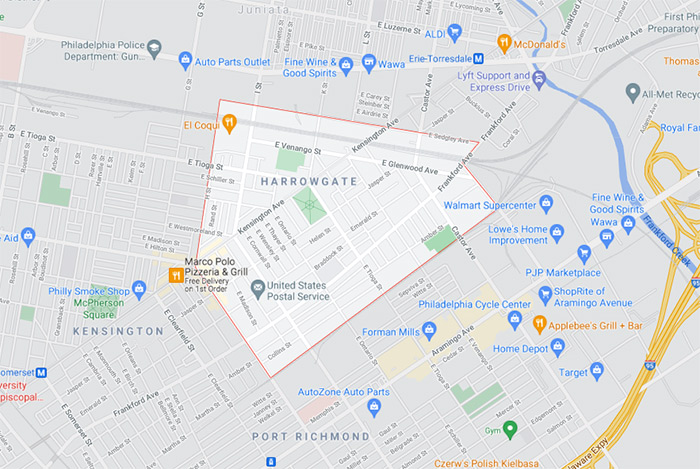
10. Harrowgate
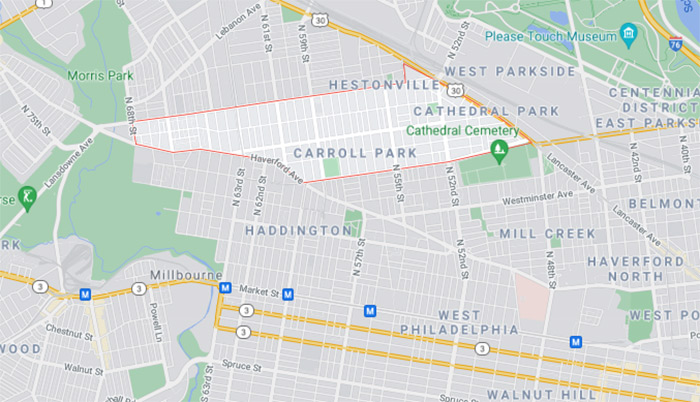
11. Carroll Park
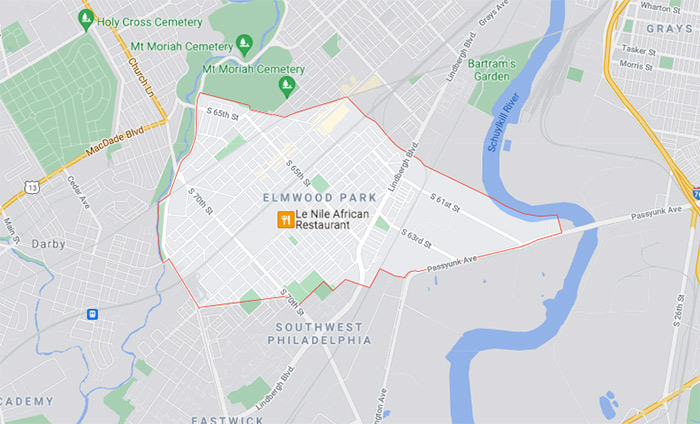
12. Elmwood
Is Downtown Philadelphia (Center City) Safe?
Downtown Philadelphia is generally safe to visit. It is a big and bustling city with lots of people around during the day time. At night it is not as well lighted as New York, so be mindful of your surroundings, stay in well lit areas and avoid talking to the homeless.
What Part of Philadelphia is Safe?
Luckily, there are still safe areas that have lower crime rates. These are the safest places you can be when traveling to Philadelphia:
Southwest Center City – is at the heart of downtown Philadelphia and has a small population of 7,835 people.
Filter Square – Filter Square has a population of 6,637 and is next to the University of Pennsylvania, Hospitals, and the Center City area.
Fish Town – This is the biggest town with a population of 25,207 and is one of the best neighborhoods to live in.
University City – Has a population of 21,228 and is home to younger residents who enjoy an urban lifestyle.
Fairmont – Has a population of 13,858 and is an inner-city neighborhood next to museums, libraries, shopping districts, and much more.
Spruce Hill – Spruce Hill has a population of 13,544 and is a historical safe residential district in Philadelphia.
Old City – has a population of 16,247 and is in the very center of Philadelphia.
Washington Square West – Has a population of 15,076 and is one of the best urban residential areas with great amenities.
Bella Vista – Bella Vista has a population of 10,177 and is near Center City with many inner-city activities and attractions.
Society Hill – Society Hill has a population of 8,376 and is a safe suburban area with many retirees.
Is Philadelphia Safe to Walk at Night?
While some areas are safer than others, you shouldn’t be walking around at night. If you find yourself in a situation where you have to be out at night, stick to busy areas. Always stay close to establishments or remain in well-lit areas and use common sense.
Is It Safe As a Woman to Visit?
While there are no guarantees, Philadelphia is generally safe for female solo travelers as long as you learn the layout of the city, avoid problem areas, stay in well lit/well populated areas and avoid walking by yourself at night.
Philadelphia Safety Tips / Advice From Residents
There are a few tips you can take to heart that can help you stay safe in Philidelphia:
Learn the layout of the city and avoid the problem areas.
Don’t walk around in a bad neighborhood at night.
Always respect the people in neighborhoods.
Use common sense, keep to well-lit areas, and make sure your phone is charged.
Don’t wear headphones or earbuds.
Always keep your valuables secure.
Be aware of your surroundings and keep your belongings tucked into your arm or pocket.
Know where you’re going and double-check the route so that you don’t look like a tourist.
Know Taxi companies in the area and keep a list on your phone or paper.
Don’t stop for panhandlers and say, “I’m sorry.”
Don’t look like a deer in headlights or paranoid, and relax.
Quick Facts About Philadelphia
Fact
Philadelphia, Pennsylvania
United States
Population, Census, April 1, 2020
1,603,797
331,449,281
Population, Census, April 1, 2010
1,526,006
308,745,538
Black or African American alone, percent
42.1%
13.4%
American Indian and Alaska Native alone, percent
0.4%
1.3%
Asian alone, percent
7.2%
5.9%
Native Hawaiian and Other Pacific Islander alone, percent
0.0%
0.2%
Two or More Races, percent
3.1%
2.8%
Hispanic or Latino, percent
14.7%
18.5%
White alone, not Hispanic or Latino, percent
34.5%
60.1%
Foreign born persons, percent, 2015-2019
14.1%
13.6%
Median value of owner-occupied housing units, 2015-2019
$163,000.00
$217,500.00
Median selected monthly owner costs -with a mortgage, 2015-2019
$1,332.00
$1,595.00
Median gross rent, 2015-2019
$1,042.00
$1,062.00
High school graduate or higher, percent of persons age 25 years+, 2015-2019
84.7%
88.0%
Bachelor’s degree or higher, percent of persons age 25 years+, 2015-2019
29.7%
32.1%
Persons without health insurance, under age 65 years, percent
9.3%
10.2%
In civilian labor force, total, percent of population age 16 years+, 2015-2019
60.9%
63.0%
Median household income (in 2019 dollars), 2015-2019
$45,927.00
$62,843.00
Per capita income in past 12 months (in 2019 dollars), 2015-2019
")

")
")
")

")
")
")
Leave a Reply