To determine which cities in the United States are the most dangerous, we compiled data from the FBI’s Uniform Crime Report and viewed each city’s violent crime rate. Violent crimes include: murder, rape, robbery and aggravated assaults.
Only cities with populations of 100,000 people or more were considered for the list. Violent crime rate is calculated by dividing the total numbers of violent crime by the total population; the result is multiplied by 100,000.
The national average for violent crime is 398.5 per 100,000 people and the The national average for property crime is 1958.2
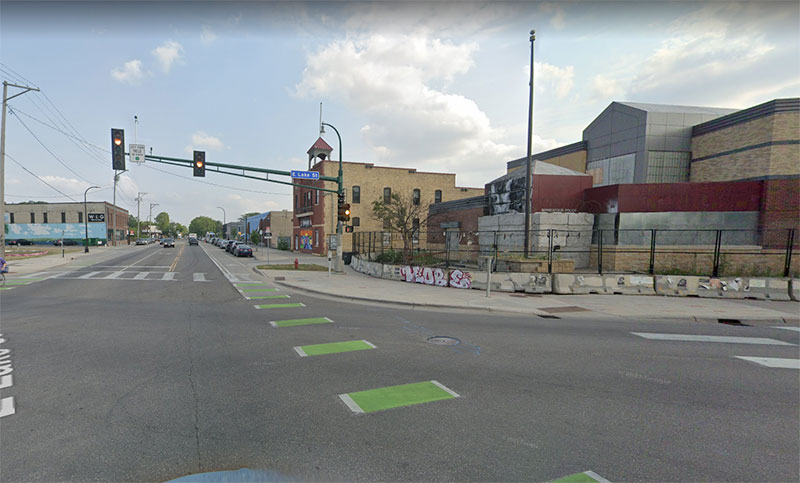
21. Minneapolis, MN- 1,262.46 violent crimes per 100,000 residents
| Population | 429,954 |
| Murders |
84 |
| Murder Rate | 19.54 |
| Property Crime Rate | 4,612.82 |
| Poverty Rate | 16.9% |
(Check out our full write-up for Minneapolis )
(map)
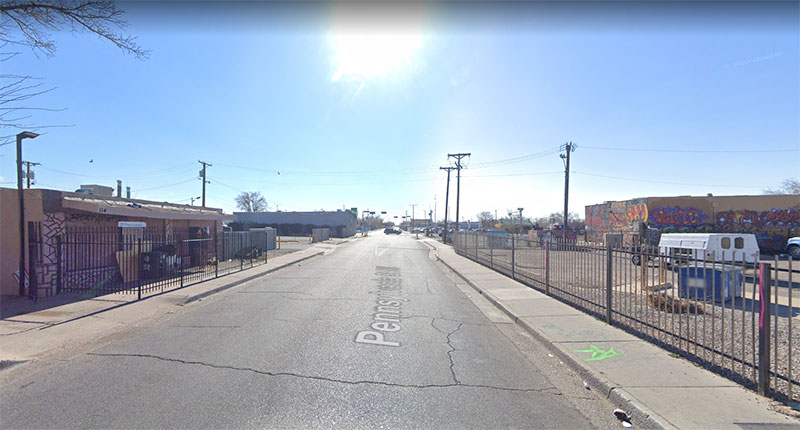
20. Albuquerque, NM – 1,337.68 violent crimes per 100k
| Population | 564,559 |
| Murders | 80 |
| Murder Rate | 14.17 |
| Property Crime Rate | 4,989.91 |
| Poverty Rate | 16.7% |
(Check out our full write-up for Albuquerque )
(map)
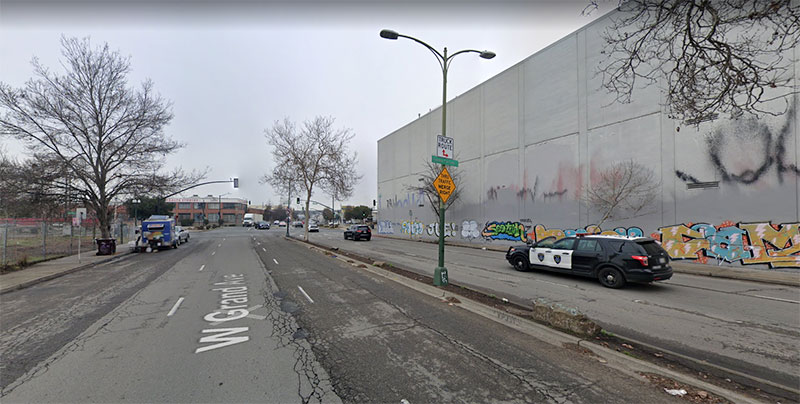
19. Oakland, California – 1,347.34 violent crimes per 100k
| Population | 440,646 |
| Murders | 102 |
| Murder Rate | 23.14 |
| Property Crime Rate | 5,133.83 |
| Poverty Rate | 16.7% |
(Check out our full write-up for Oakland )
(map)
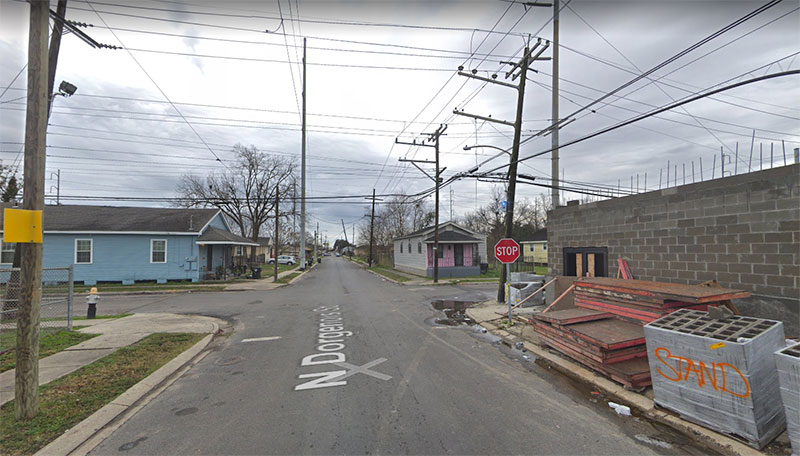
18. New Orleans, Louisiana – 1,358.08 violent crimes per 100,000 residents
| Population |
383,997
|
| Murders | 195 |
| Murder Rate | 50.78 |
| Property Crime Rate | 4,655.24 |
| Poverty Rate | 23.7% |
(map)
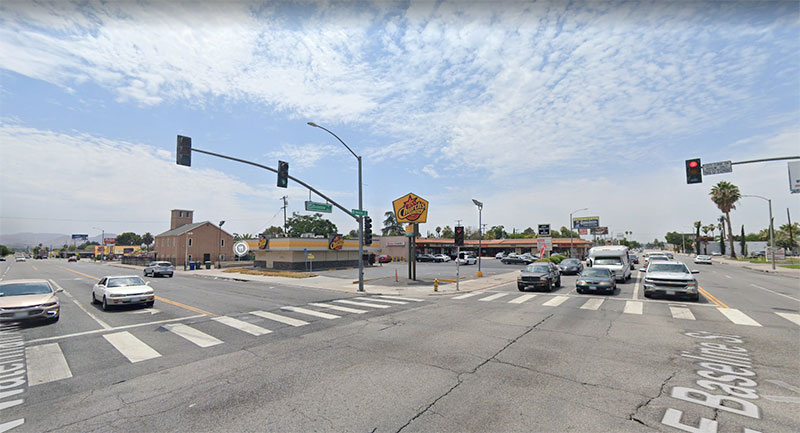
17. San Bernardino, California – 1,365.59 violent crimes per 100,000 residents
| Population | 222,101 |
| Murders | 69 |
| Murder Rate | 31.06 |
| Property Crime Rate | 2,728.04 |
| Poverty Rate | 26% |
(Check out our full write-up for San Bernardino)
(map)
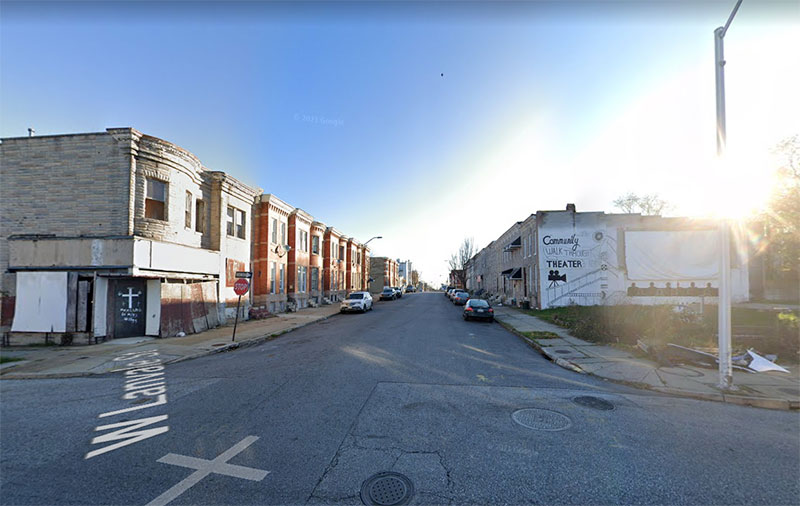
16. Baltimore, Maryland – 1,460.11 violent crimes per 100,000 residents
| Population |
585,708
|
| Murders | 335 |
| Murder Rate | 57.19 |
| Property Crime Rate | 2,887.62 |
| Poverty Rate | 16.7% |
(Check out our full write-up for Baltimore )
(map)
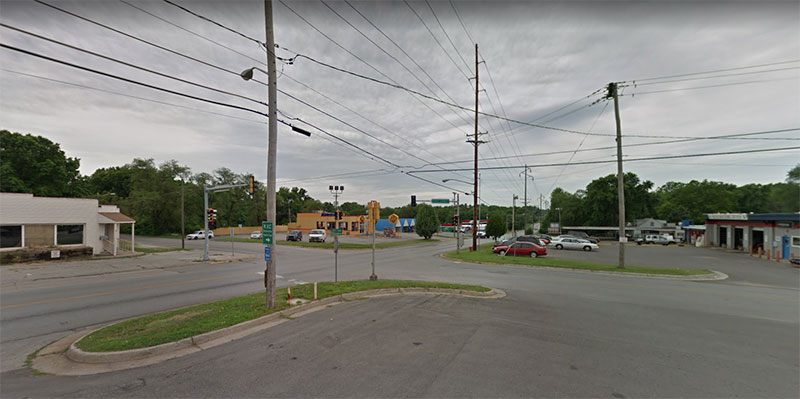
15. Kansas City, Missouri – 1,558.58 violent crimes per 100,000 residents
| Population | 508,090 |
| Murders | 176 |
| Murder Rate | 34.63 |
| Property Crime Rate | 4,048.50 |
| Poverty Rate | 16.1% |
(map)
14. Birmingham, Alabama – 1,577.22 violent crimes per 100,000 residents
| Population | 200,733 |
| Murders |
122 |
| Murder Rate | 60.78 |
| Property Crime Rate | 1,487.05 |
| Poverty Rate | 24.7% |
(Check out our full write-up for Birmingham )
(map)
13. Milwaukee, Wisconsin – 1,629.70 violent crimes per 100,000 residents
| Population | 577,222 |
| Murders | 190 |
| Murder Rate | 32.91 |
| Property Crime Rate | 2,784.72 |
| Poverty Rate | 16.7% |
(Check out our full write-up for Milwaukee)
(map)
12. Camden, New Jersey – 1,632.52 violent crimes per 100,000 residents
| Population |
71,791 |
| Murders |
23 |
| Murder Rate | 32.03 |
| Property Crime Rate | 2,199.44 |
| Poverty Rate | 33.6% |
(Check out our full write-up for Camden )
(map)
11. Cleveland, Ohio – 1,689.10 violent crimes per 100,000 residents
| Population | 372,624 |
| Murders | 177 |
| Murder Rate | 47.5 |
| Property Crime Rate | 4,142.25 |
| Poverty Rate | 32.7% |
(map)
10. South Bend, Indiana – 1,706.09 violent crimes per 100,000 residents
| Population | 103,453 |
| Murders | 28 |
| Murder Rate | 27.06 |
| Property Crime Rate | 3,616.13 |
| Poverty Rate | 21.5% |
(map)
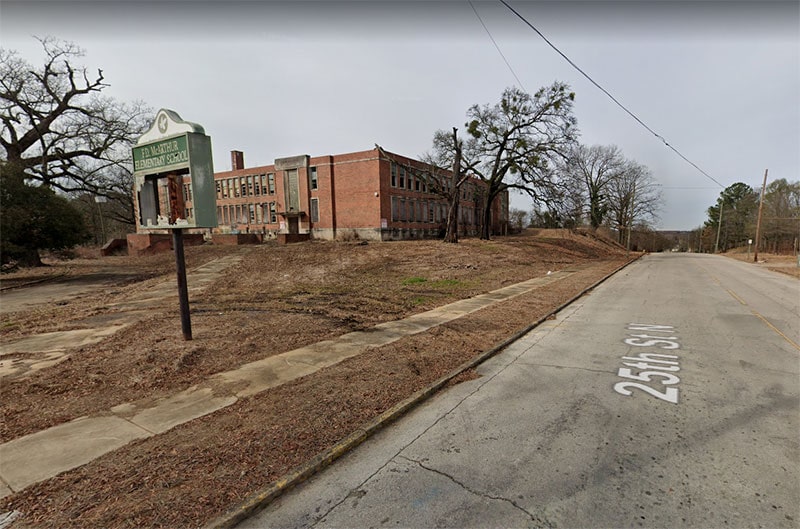
9. Little Rock, Arkansas – 1,805.11 violent crimes per 100,000 residents
| Population | 202,591 |
| Murders |
49 |
| Murder Rate | 24.18 |
| Property Crime Rate | 4,739.60 |
| Poverty Rate | 21.8% |
(Check out our full write-up for Little Rock)
(map)
8. Pine Bluff, Arkansas – 1,808.35 violent crimes per 100,000 residents
| Population | 41,253 |
| Murders | 23 |
| Murder Rate | 55.75 |
| Property Crime Rate | 4,823.89 |
| Poverty Rate | 25.4% |
(map)
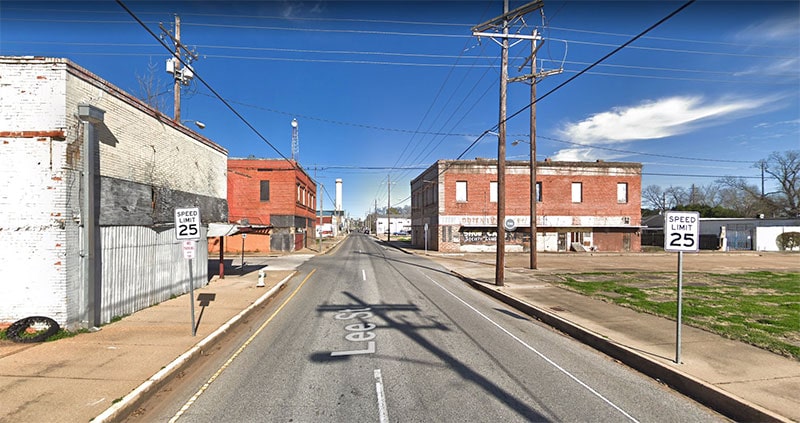
7. Alexandria, Louisiana – 1,877.42 violent crimes per 100,000 residents
| Population | 45,275 |
| Murders | 19 |
| Murder Rate | 41.96 |
| Property Crime Rate | 7,326.34 |
| Poverty Rate | 26.9% |
(map)
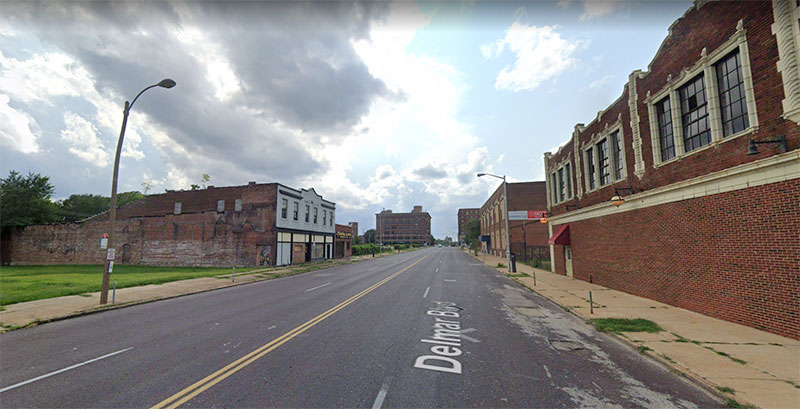
6. St Louis, Missouri – 1,995.17 violent crimes per 100,000 residents
| Population | 301,578 |
| Murders | 262 |
| Murder Rate | 86.87 |
| Property Crime Rate | 5,769.32 |
| Poverty Rate | 21.8% |
(Check out our full write-up for St. Louis)
(map)
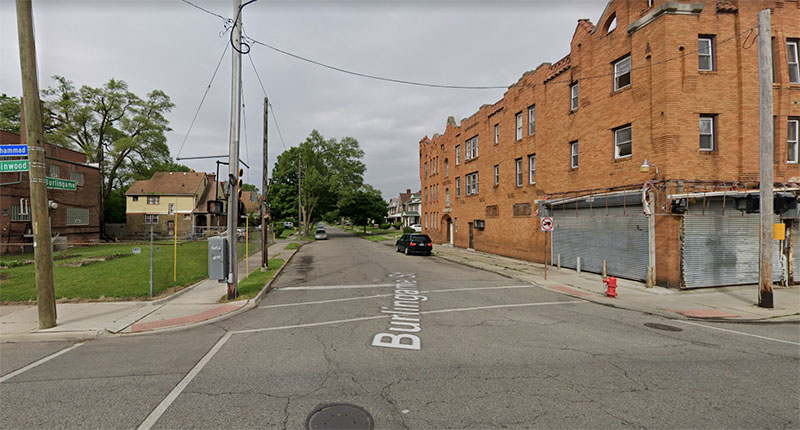
5. Detroit, Michigan – 2,248.44 violent crimes per 100,000 residents
| Population | 639,111 |
| Murders | 327 |
| Murder Rate | 51.16 |
| Property Crime Rate | 3,313.67 |
| Poverty Rate | 35% |
(Check out our full write-up for Detroit )
(map)
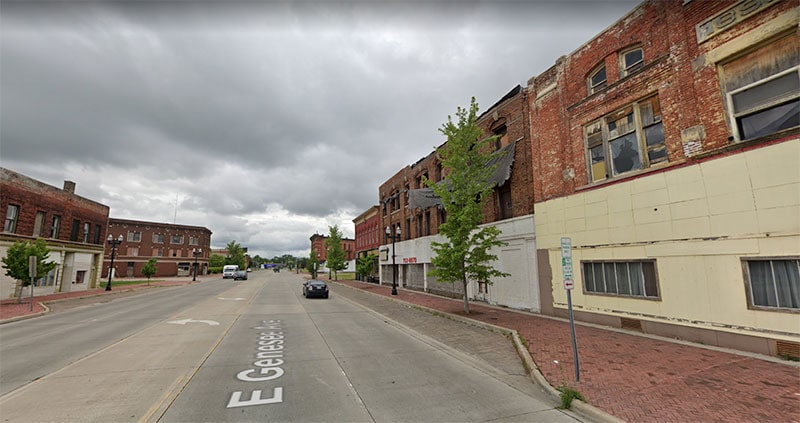
4. Saginaw, Michigan – 2,327.95 violent crimes per 100k
| Population | 44,202 |
| Murders | 24 |
| Murder Rate | 54.29 |
| Property Crime Rate | 1,628.89 |
| Poverty Rate | 34.6% |
(map)
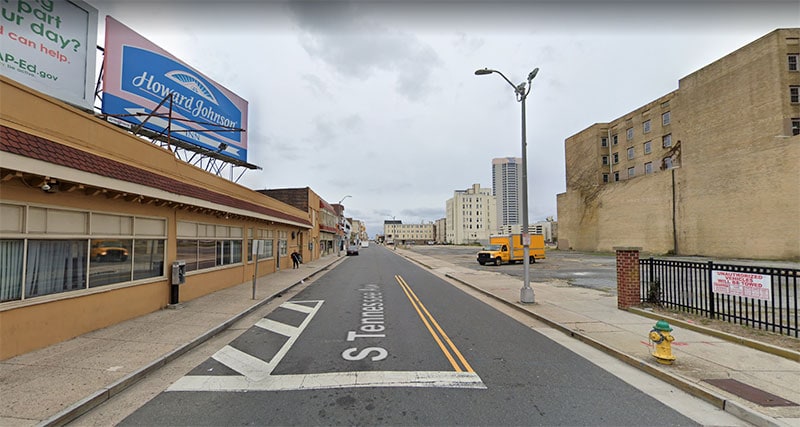
3. Atlantic City, New Jersey – 2,335.25 violent crimes per 100,000 residents
| Population | 38,497 |
| Murders |
9 |
| Murder Rate | 23.38 |
| Property Crime Rate | 2,631.37 |
| Poverty Rate | 35.2% |
(Check out our full write-up for Atlantic City)
(map)
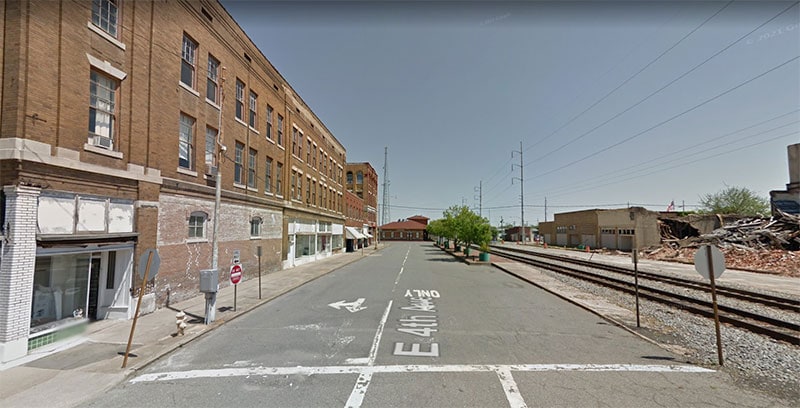
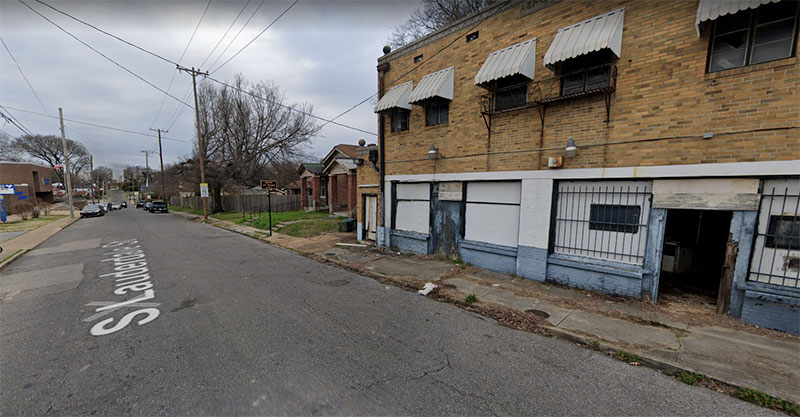
2. Memphis, Tennessee – 2,418.24 violent crimes per 100,000 residents
| Population | 633,104 |
| Murders | 334 |
| Murder Rate | 52.75 |
| Property Crime Rate | 5,717.39 |
| Poverty Rate | 16.7% |
(Check out our full write-up for Memphis)
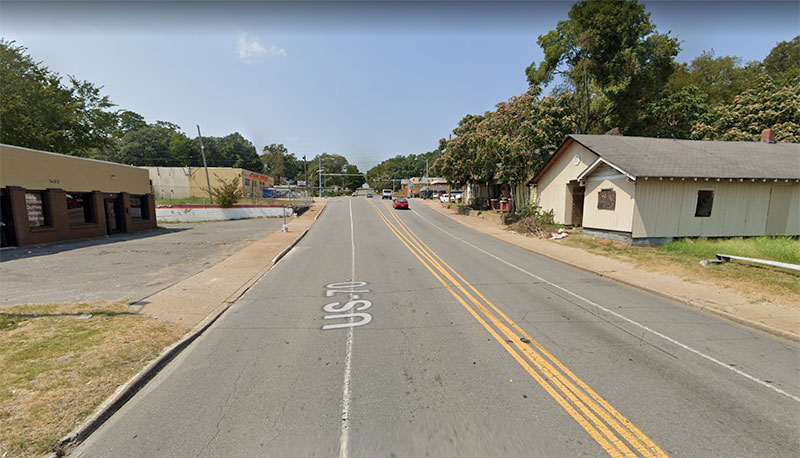
1. Monroe, Louisiana – 2,932.79 violent crimes per 100,000 residents
| Population | 47,702 |
| Murders | 19 |
| Murder Rate | 39.83 |
| Property Crime Rate | 6,043.77 |
| Poverty Rate | 16.7% |
The Most Dangerous Cities In The United States 2022
|
City |
Population |
Violent Crime Rate |
Property Crime Rate |
|
1. Monroe, LA |
47,702 |
2,932.79 |
6,043.77 |
|
2. Memphis, TN |
633,104 |
2,418.24 |
5,717.39 |
|
3. Atlantic City, NJ |
38,497 |
2,335.25 |
2,631.37 |
|
4. Saginaw, MI |
44,202 |
2,327.95 |
1,628.89 |
|
5. Detroit, MI |
639,111 |
2,248.44 |
3,313.67 |
|
6. St. Louis, MO |
301,578 |
1,995.17 |
5,769.32 |
|
7. Alexandria, LA |
45,275 |
1,877.42 |
7,326.34 |
|
8. Pine Bluff, AR |
41,253 |
1,808.35 |
4,823.89 |
|
9. Little Rock, AR |
202,591 |
1,805.11 |
4,739.60 |
|
10. South Bend, IN |
103,453 |
1,706.09 |
3,616.13 |
|
11. Cleveland, OH |
372,624 |
1,689.10 |
4,142.25 |
|
12. Camden, NJ |
71,791 |
1,632.52 |
2,199.44 |
|
13. Milwaukee, WI |
577,222 |
1,629.70 |
2,784.72 |
|
14. Birmingham, AL |
200,733 |
1,577.22 |
1,487.05 |
|
15. Kansas City, MO |
508,090 |
1,558.58 |
4,048.50 |
|
16. Baltimore, MD |
585,708 |
1,460.11 |
2,887.62 |
|
17. San Bernardino, CA |
222,101 |
1,365.59 |
2,728.04 |
|
18. New Orleans, LA |
383,997 |
1,358.08 |
4,655.24 |
|
19. Oakland, CA |
440,646 |
1,347.34 |
5,133.83 |
|
20. Albuquerque, NM |
564,559 |
1,337.68 |
4,989.91 |
|
21. Minneapolis, MN |
429,954 |
1,262.46 |
4,612.82 |
You might also be interested in these other states:


Related Posts:
")

")
")


")
Leave a Reply