Santa Ana is a flourishing city nestled in the enclave of suburbia. While it doesn’t offer the squeaky clean reputation of its neighbors, it more than makes up for it in things to do, see, hear, eat and experience.
If you are thinking about visiting Santa Ana and have some qualms about the safety of the city, we got you covered.
We are going to deep dive into the statistics, look at some maps, graphs and talk to the residents of the city to give you a better understanding of how safe the city really is.
Is Santa Ana Safe?
Looking at the crime statistics, Santa Ana is a safe place to visit. In 2019, Santa Ana had a violent crime rate of 436.6 per 100,000 people. Out of the 100 most populous cities in the United States, Santa Ana’s violent crime rate ranked 66th. Austin, Portland, Bakersfield and Glendale all have similar crime rates as Santa Ana.
Santa Ana’s Population
The population for the Santa Ana in 2019 is 332,794
Santa Ana Crime Stats
Here’s a breakdown of all the crimes in Santa Ana for 2018 and 2019.
In 2019 Santa Ana reported 1,453 violent crimes and had a violent crime rate of 436.6 per 100,000 people. The national average for violent crime is 366.7 per 100,000 residents. Santa Ana’s violent crime rate is 19% higher than the national average.
*Violent crimes include; homicides, rape, robbery and aggravated assaults and the violent crime rate is calculated by dividing the number of reported crimes by the total population; the result is multiplied by 100,000.
Santa Ana Property Crime Rate
In 2019 Santa Ana reported 6,808 property crimes and had a property crime rate of 2,045.7 per 100,000 people. The national average for property crime is 2,109.9 per 100,000 residents. Santa Ana’s property crime rate is 3% less than the national average.
**Property crimes include; arson, burglary, larceny-theft, and motor vehicle theft are classified as property crimes. The property crime rate is calculated by dividing the number of reported crimes by the total population; the result is multiplied by 100,000.
Santa Ana Murder Stats
In 2019 Santa Ana reported 13 homicides, which gives it a murder rate of 3.9 per 100,000 residents. The national murder rate is 5 per 100,000 people. Santa Ana’s murder rate is 22% less than the national average. To put it in perspective, St. Louis had a murder rate of 86.87 in 2020. Santa Ana’s murder rate is 22 times LESS than St. Louis.
Santa Ana vs The Rest Of California
Here’s a table showing you violent crime rate and property crime rate of the top 20 most populous cities in the state of California.
Santa Ana’s violent crime rate of 436.6, places it in 12th place behind San Jose.
Santa Ana vs The Most Dangerous Cities In The United States
Here’s a list of the top 10 most dangerous cities in the United States ranked by violent crime rate. It can give you some perspective on Santa Ana’s violent crime rate, which is 436.6 per 100,000 people.
Santa Ana’s violent crime rate is 5.5 times LESS than Memphis, the most dangerous city on the list.
What do residents of Santa Ana say about its safety
"Santa Ana is fairly safe. There are certain areas that you don’t want to be in a 2am, but overall it’s safe."
"Santa Ana is not Chicago or Oakland. It’s a city nestled in one the safest counties in all of America. It has some rough patches but it is pretty safe."
"Rich people in Orange County think every lower income neighborhoods are dangerous and violent but that couldn’t be further from the truth. Santa Ana is super safe compared to cities like Detroit or St. Louis."
"If you lived in a suburb where you have been shielded from crime for most of your life, then Santa Ana is probably dangerous to you. If you ever venture outside the bubble and lived in a big city like Los Angeles or New York, than Santa Ana is relatively safe."
"Santa Ana is definitely not Baltimore, not even close. Its a lower income area and while there are some Orange County residents who say it’s unsafe, it’s relative to them being used to absolutely no crime."
"Santa Ana has its rough patches, but its not as intense as word of mouth would like you to believe."
"15-20 years ago, you wouldn’t drive through Santa Ana, but it is totally different now. Its becoming gentrified and you can walk through many places at night."
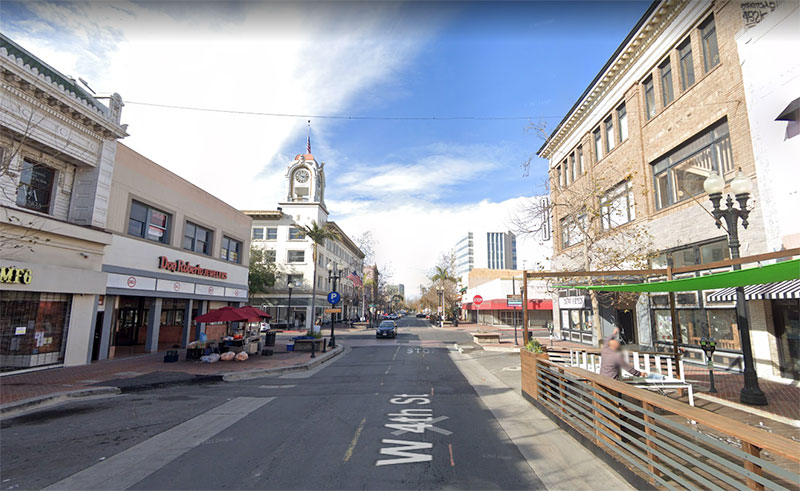
Is Downtown Santa Ana Safe?
Downtown Santa Ana is safe to visit at night and is one of the livelier parts of the city. There is a lot of investment into the downtown area right now and it is being slowly gentrified. You will find a lot of cool bars, restaurants and shops in the area.
Is Santa Ana safe at night?
Santa Ana is safe at night if you avoid going into the dangerous areas mentioned below, which are areas tourist wouldn’t want to visit anyways.
Is it safe to visit alone?
Santa Ana is a safe place to visit alone. You can mitigate your chances of becoming a victim if you learn the layout of the city, avoid the sketchy areas and follow the safety tips posted below.
Tips To Stay Safe In Santa Ana
Avoid going into dark and secluded areas.
Learn the layout of the city and avoid going into the neighborhoods mentioned below, especially at night.
Don’t walk alone in the streets late at night. If you are in downtown, you are generally safe at night but you should still be aware of your surroundings.
Keep situational awareness at all times. Don’t bury yourself in your phone. Don’t listen to music while walking.
Don’t count your money where others can see you.
Monitor your drink at all times.
Travel in groups late at night. Criminals like to target lone individuals.
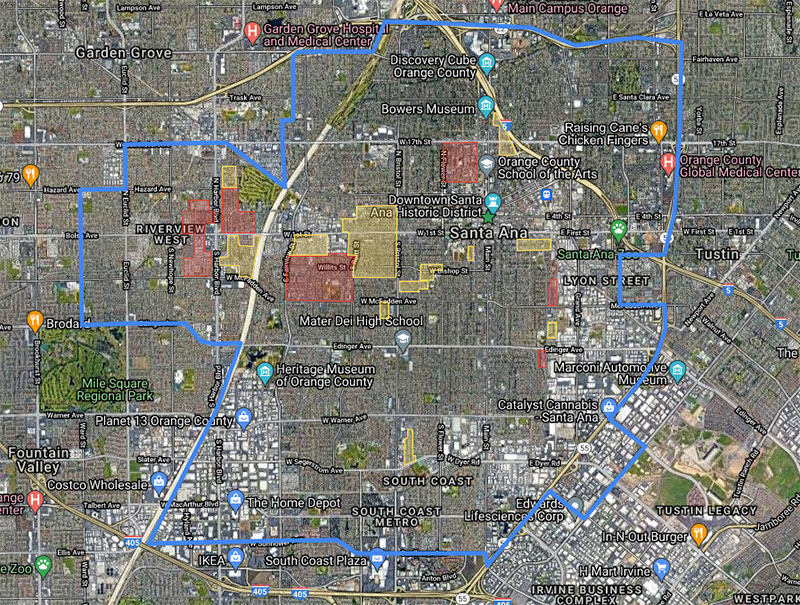
Santa Ana’s Most Dangerous Neighborhoods
Minnie Street
Townsend
Bishop Street
Evergreen
Willard
Santa Anita
West Riverview
Final Thoughts
Santa Ana is a safe place to visit. It’s crime statistics are low and slightly higher than the national average. It’s just a city that gets a bad rap because its lower income and surrounded by rich neighbors who live in sterile suburbs.
You will be fine in most places in Santa Ana, but avoid going into the areas mentioned above at night and you should be able to mitigate your chances of becoming a victim.
Quick Facts About Santa Ana
Fact
Santa Ana, California
United States
Population, Census, April 1, 2020
310,227
331,449,281
Population, Census, April 1, 2010
324,528
308,745,538
White alone, percent
40.2%
76.3%
Black or African American alone, percent
1.1%
13.4%
Asian alone, percent
11.8%
5.9%
Hispanic or Latino, percent
76.8%
18.5%
Median value of owner-occupied housing units, 2015-2019
$491,300.00
$217,500.00
Median selected monthly owner costs -with a mortgage, 2015-2019
$2,136.00
$1,595.00
Median gross rent, 2015-2019
$1,563.00
$1,062.00
Living in same house 1 year ago, percent of persons age 1 year+, 2015-2019
90.2%
85.8%
High school graduate or higher, percent of persons age 25 years+, 2015-2019
59.6%
88.0%
Bachelor’s degree or higher, percent of persons age 25 years+, 2015-2019
15.0%
32.1%
In civilian labor force, total, percent of population age 16 years+, 2015-2019
67.6%
63.0%
Mean travel time to work (minutes), workers age 16 years+, 2015-2019
25.5
26.9
Median household income (in 2019 dollars), 2015-2019
$66,145.00
$62,843.00
Per capita income in past 12 months (in 2019 dollars), 2015-2019

")
")
")
")
")
")

")
Leave a Reply