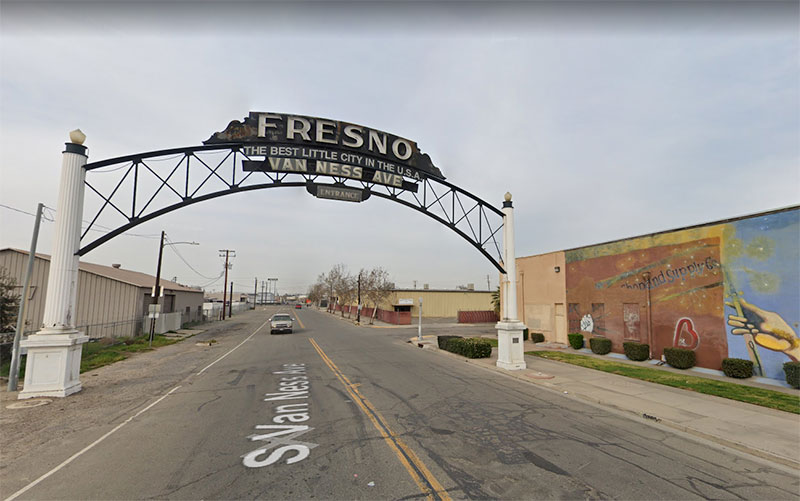
If you are thinking about visiting Fresno and have some qualms about the safety of the city, we got you covered.
We are going to deep dive into the statistics, look at some maps, graphs and talk to the residents of the city to give you a better understanding of how safe Fresno really is.
Is Fresno Safe To Visit?
Statistically speaking, Fresno is a marginally safe place to visit. In 2020, Fresno had a violent crime rate of 656.69. Out of the 100 most populous cities in the United States, Fresno’s violent crime rate ranks 47th place. Pittsburgh, Long Beach and Boston all have similar violent crime rates.
Fresno’s Population
The population for the Fresno in 2020 was 542,107
Fresno Crime Stats
Here’s a breakdown of all the crimes in Fresno for 2019 and 2020.
In 2020 Fresno reported 3,560 violent crimes and had a violent crime rate of 656.69 per 100,000 people. The national average for violent crime is 366.7 per 100,000 residents.
Fresno’s violent crime rate is 1.8x greater than the national average.
*Violent crimes include; homicides, rape, robbery and aggravated assaults and the violent crime rate is calculated by dividing the number of reported crimes by the total population; the result is multiplied by 100,000.
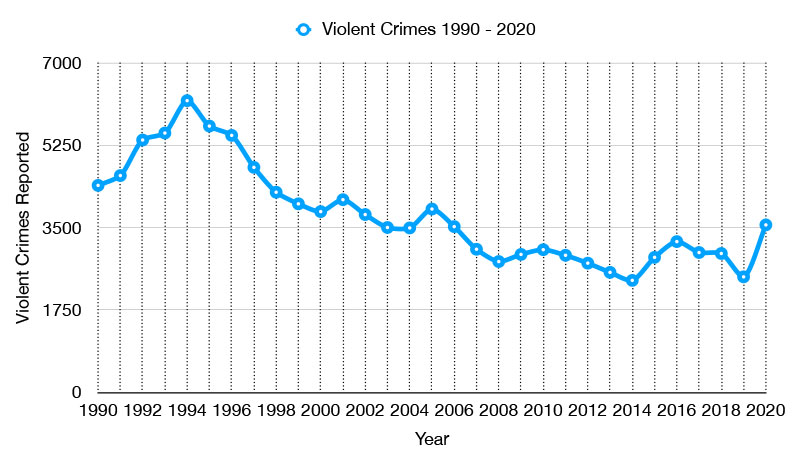
Here’s a graph showing you the violent crime trends from 1990-2020. Violent crime in Fresno peaked in 1994 when there were 6,199 violent crimes reported and its estimated violent crime rate was 1,631.30 per 100,000 residents.
Fresno Property Crime Rate
In 2020 Fresno reported 16,474 property crimes and had a property crime rate of 3,038.88 per 100,000 people. The national average for property crime is 2,109.9 per 100,000 residents. Fresno’s property crime rate is 1.4x greater the national average.
Out of the 100 most populous cities in the United States, Fresno’s property crime rate ranked 66th place.
**Property crimes include; arson, burglary, larceny-theft, and motor vehicle theft are classified as property crimes. The property crime rate is calculated by dividing the number of reported crimes by the total population; the result is multiplied by 100,000.
Fresno Murder Stats
In 2020 Fresno reported 77 homicides, which was a staggering 77% increase over 2019, where 45 homicides were reported.
In 2020 Fresno had a murder rate of 14.2 per 100,000 residents. The national murder rate is 5 per 100,000 people. Fresno’s murder rate is 2.8x greater the national average.
The last time murder was this bad in Fresno was in 1994 when it reported 87 murders.
As of July 21, 2021, there have already been 42 homicides reported and is on pace to break 2020’s record.
Out of the 100 most populous cities in the United States, Fresno’s murder rate ranked 30th.
To put it in perspective, St. Louis had a murder rate of 86.87 in 2020. Fresno’s murder rate is 6 times less than St. Louis’.
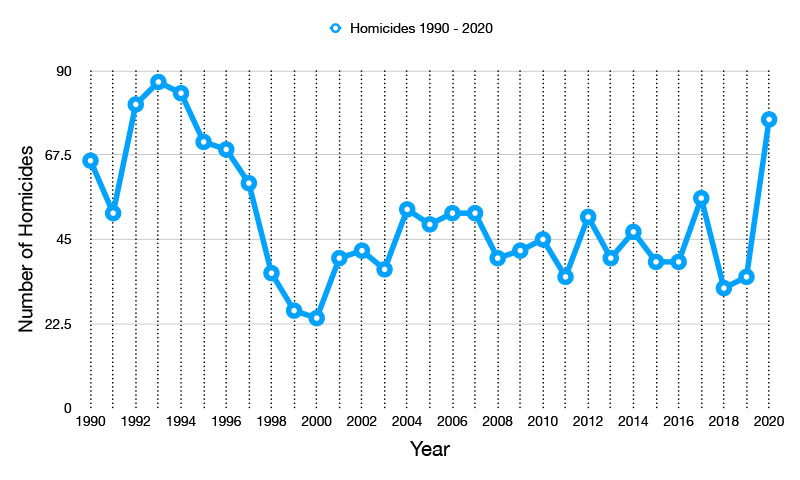
Here’s a graph showing you the murder trends from 1990-2020. Murders in Fresno peaked in 1993 when there were 87 homicides reported and its estimated murder rate was 23.5 per 100,000 residents.
Fresno Shootings
Fresno has a shooting problem. In 2020, Fresno broke its record for most reported shootings of all time. There were 724 shootings reported in 2020, which is double that of 2019.
Fresno vs The Rest Of California
Here’s a table showing you violent crime rate and property crime rate of the top 20 most populous cities in the state of California.
Fresno had the 7th highest violent crime rate of the most populous cities in California
Fresno vs The Most Dangerous Cities In The United States
Here’s a list of the top 10 most dangerous cities in the United States ranked by violent crime rate. It can give you some perspective on Fresno’s violent crime rate, which is 656.69 per 100,000 people.
Fresno’s violent crime rate is 3.68 times LESS than Memphis, the most dangerous city on the list.
"Crtics of Fresno overstate the crime problems, and people who defend Fresno overstate its perks. It really is about as average as you can get."
"Fresno, for lack of a better phrase is a shit hole. Tons of smog, crippling property poverty, methheads and tweekers galore, hella gangs."
"Avoid the unincorporated territories. Calwa, malaga, pinedale, etc."
The further north you go, the nicer and quieter it is. Stay north of Shaw or Herndon. Chinatown is a hellhole."
"The Tower District is okay. There are some streets I wouldn’t hangout in my front yard though."
"The area inside ‘the triangle’ (180, 41, 99) is a bit rough"
"I live in the downtown area and it’s depressing. There isnt anywhere I feel safe to ride my bike or any paths where I feel safe walking my dog."
The further North you are from Olive the better, the further East you are from West the better. North and East of Fresno High is awesome, south and west can get a little dicey depending on how close to the freeway and past Olive you get. If you get to Belmont you’ve gone too far and are definitely in the ghetto.
The roughest neighborhood is called the “dog pound." It is neighborhood southwest of Elm & Jensen.. There is a very high number of gang activity and shootings, especially around Tupman Street."
"At night anything can happen in Fresno. Stay out of downtown, southeast or southwest side of town"
"There is no safe neighborhood here. Even the ‘good areas’ have shootings, homeless and drugs addcits too."
"I have lived here 50 years and I wouldn’t say it is as bad as Chicago. There are shootings every day or someone being stabbed and you have to be on guard at all times no matter where you live."
"Like most places. Fresno has good and bad areas."
"Chinatown is fine to visit between the hours of 8-2pm. After that, especially into the evening safety is questionable with most businesses closed."
Is Fresno safe at night? / Is it safe to visit alone?
Fresno can be a safe place to visit if you study the layout of the city and avoid the problem areas.
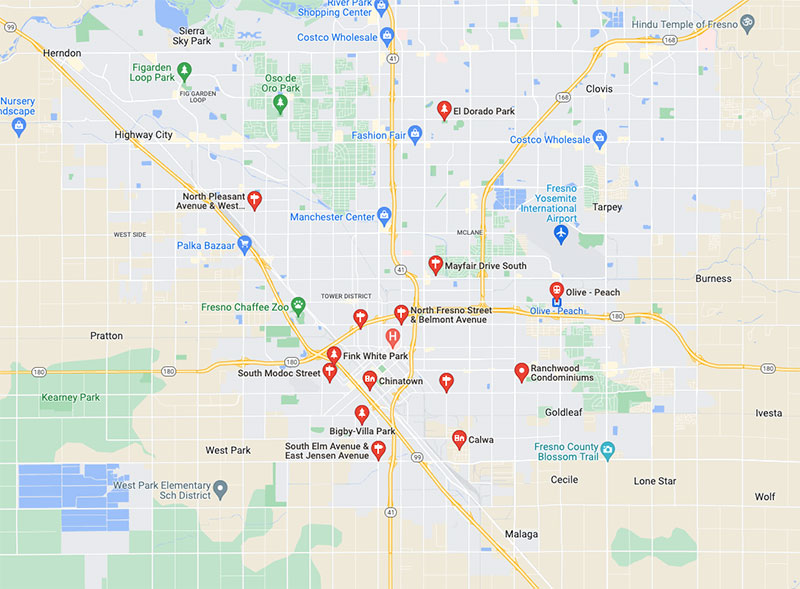
Fresno’s Worst Neighborhoods
Here’s a map showing you the worst neighborhoods of Fresno according to residents of the city:
Jensen and Elm (Dog Pound)
Calwa
Belmont ave and Fresno
Bigby Villa
Fink White
Pleasant and Dakota
Ranchwoods
Peach and Olive
El Dorado Park
Mayfair District
Orange Ave and Butler
Chinatown
Franklin and College
Modoc St
Is Downtown Fresno Safe?
Downtown is safe to visit during the day time. At night it gets deserted and the safety of the area is questionable. Locals will also tell you that downtown Fresno is dangerous and suffers from a theft problem. Anything valuable inside your car will be stolen.
There have been talks about revitalization but those talks have been going on for decades.
A better place to visit is the Tower District, which is livlier and offers good bars, restaurants, cafes, entertainment etc.
Final Thoughts
While Fresno’s violent crime rate isn’t as concerning as cities like Detroit or Memphis, there have been an alarming increase in the amounts of shooting and murders in the city.
You can mitigate your risks of being a victim of crime if you learn the layout of the city and avoid the areas mentioned above.
A good rule of thumb is to avoid everything south of 180 and west of 99 and avoid everything south of 180 and east of 41.
Quick Facts About Fresno
Fact
Fresno, California
United States
Population, Census, April 1, 2020
542,107
331,449,281
Population, Census, April 1, 2010
494,665
308,745,538
White alone, percent
60.5%
76.3%
Black or African American alone, percent
7.4%
13.4%
American Indian and Alaska Native alone, percent
1.2%
1.3%
Asian alone, percent
13.8%
5.9%
Native Hawaiian and Other Pacific Islander alone, percent
0.1%
0.2%
Two or More Races, percent
4.2%
2.8%
Hispanic or Latino, percent
49.6%
18.5%
White alone, not Hispanic or Latino, percent
26.9%
60.1%
Foreign born persons, percent, 2015-2019
20.4%
13.6%
Median value of owner-occupied housing units, 2015-2019
$242,000.00
$217,500.00
Median selected monthly owner costs -with a mortgage, 2015-2019
$1,584.00
$1,595.00
Median gross rent, 2015-2019
$1,005.00
$1,062.00
High school graduate or higher, percent of persons age 25 years+, 2015-2019
77.4%
88.0%
Bachelor’s degree or higher, percent of persons age 25 years+, 2015-2019
21.9%
32.1%
In civilian labor force, total, percent of population age 16 years+, 2015-2019
61.8%
63.0%
Median household income (in 2019 dollars), 2015-2019
$50,432.00
$62,843.00
Per capita income in past 12 months (in 2019 dollars), 2015-2019
")
")
")
")
")
")
")
")
")
Leave a Reply