If you are thinking about visiting Burbank and have some qualms about the safety of the city, we got you covered.
We are going to deep dive into the statistics, look at some maps, graphs and talk to the residents of the city to give you a better understanding of how safe Burbank really is.
Is Burbank Safe To Visit?
Statistically speaking, Burbank is a very safe place to visit. It has one of the lowest crime rates in the nation. In 2020, Burbank had a violent crime rate of 162.1 per 100,000 people.
Out of the 100 most populous cities in the United States, Burbank’s had the 92nd lowest rate. Irvine, Fremont and Santa Clarita all have similar violent crime rates.
Burbank’s Population
The population for the Burbank in 2020 was 107,337
Burbank Crime Stats
Here’s a breakdown of all the crimes in Burbank for 2019 and 2020.
In 2020 Burbank reported 174 violent crimes and had a violent crime rate of 162.1 per 100,000 people. The national average for violent crime is 366.7 per 100,000 residents.
Burbank’s violent crime rate is 2.3x LESS than the national average.
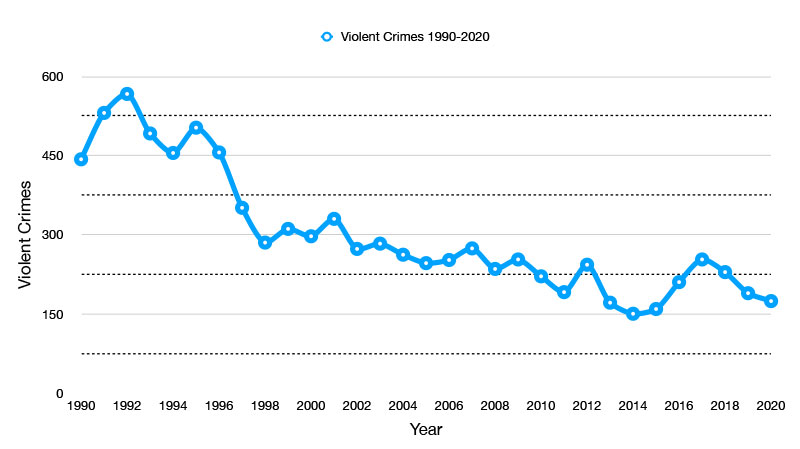
Here’s a graph showing you the violent crime trends from 1990-2020. Violent crime in Burbank peaked in 1992 when there were 567 violent crimes reported and its estimated violent crime rate was 603.2 per 100,000 residents.
*Violent crimes include; homicides, rape, robbery and aggravated assaults and the violent crime rate is calculated by dividing the number of reported crimes by the total population; the result is multiplied by 100,000.
Burbank Property Crime Rate
In 2020 Burbank reported 2,474 property crimes and had a property crime rate of 2,304.9 per 100,000 people. The national average for property crime is 2,109.9 per 100,000 residents. Burbank’s property crime rate is 9% greater the national average.
Out of the 100 most populous cities in the United States, Burbank’s had the 82nd lowest property crime rate.
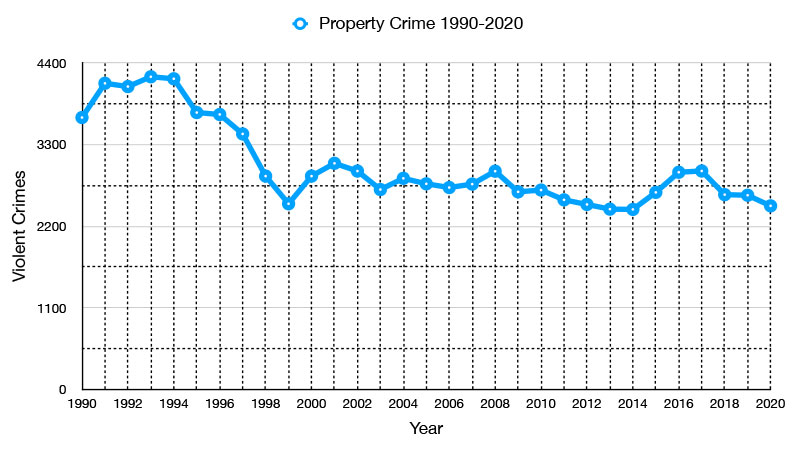
Here’s a graph showing you the property crime trends from 1990-2020. Violent crime in Burbank peaked in 1993 when there were 4,213 violent crimes reported and its estimated violent crime rate was 4,481.9 per 100,000 residents.
**Property crimes include; arson, burglary, larceny-theft, and motor vehicle theft are classified as property crimes. The property crime rate is calculated by dividing the number of reported crimes by the total population; the result is multiplied by 100,000.
Burbank Murder Stats
In 2020 Burbank reported 1 homicide and had a murder rate of 0.93 per 100,000 residents.
The national murder rate is 5 per 100,000 people. Burbank’s murder rate is 5.4x LESS the national average.
As of December 1, 2021, there have 2 homicides reported in Burbank.
Out of the 100 most populous cities in the United States, Burbank’s murder rate ranked 96th, meaning there were only 4 cities with lower murder rates: Boise, Fremont, Chula Vista and Irvine.
To put it in perspective, St. Louis had a murder rate of 86.87 in 2020. Burbank’s murder rate is 93x less!
Burbank vs The Rest Of California
Here’s a table showing you violent crime rate and property crime rate of the top 20 most populous cities in the state of California.
Burbank’s violent crime rate of 162.1 would place it at 18th lowest behind Santa Clarita and Irvine.
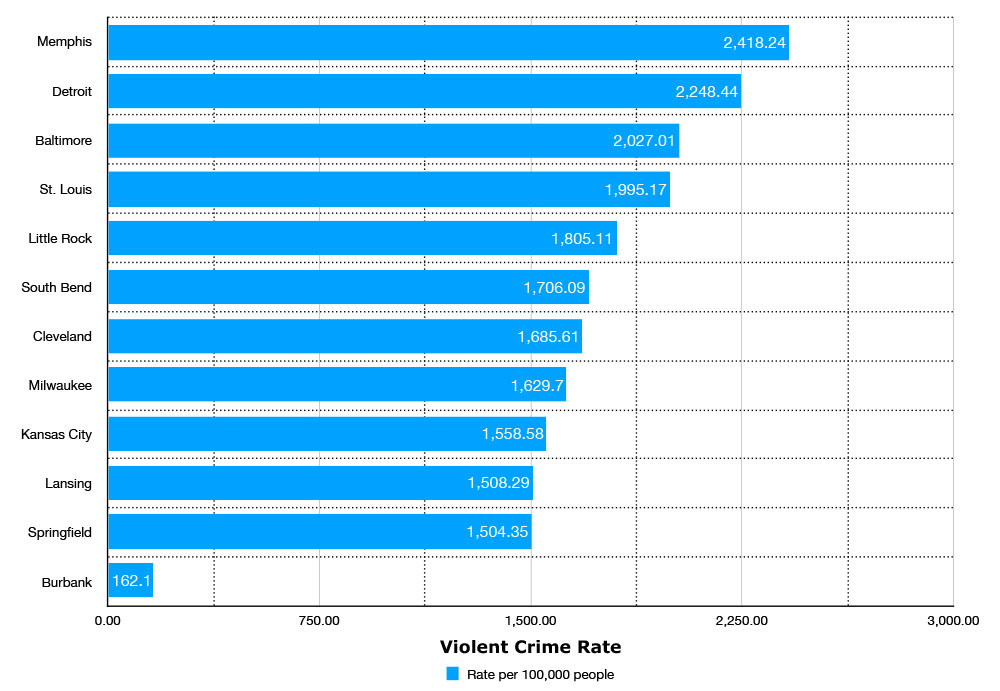
Burbank vs The Most Dangerous Cities In The United States
Here’s a list of the top 10 most dangerous cities in the United States ranked by violent crime rate. It can give you some perspective on Burbank’s violent crime rate, which is 656.69 per 100,000 people.
Burbank’s violent crime rate is nearly 15 times LESS than Memphis, the most dangerous city on the list.
"As a woman, I have jogged all l over Burbank and I never felt unsafe."
"Burbank for the most part is pretty safe, quiet and reliable."
"Burbank has its own police department and they don’t mess around when it comes to crime. They are pretty much on it and it shows in the safety of the neighborhoods. There aren’t too many bad areas, but I would say that the closer you get to North Hollywood, things get more rough."
"Burbank is one of the safest cities in Los Angeles."
"Burbank is a low crime area and very safe."
Is Burbank safe at night? / Is it safe to visit alone?
Burbank is safe at night and it is also safe to visit alone. You might want to learn the layout of the area, so you don’t wander off into parts of North Hollywood where things can get a little sketchy.
Is Downtown Burbank Safe?
Downtown Burbank is safe to visit day and night. There are a lot of cool shops, restaurants and bars in the area and plus the Burbank Police station is only a block away. The biggest thing you would have to worry about is some drunk idiot who can’t handle his liquor.
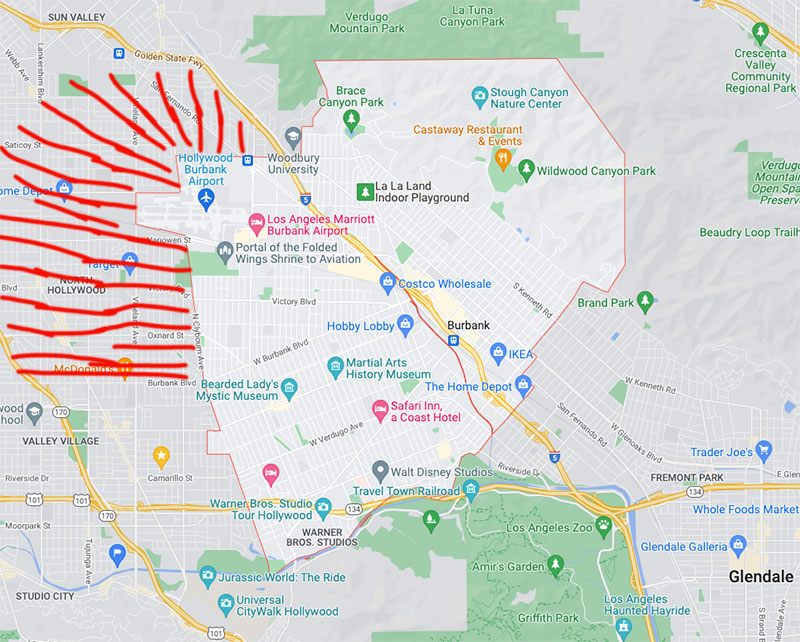
Areas Near Burbank To Avoid
Here’s a map of Burbank and the areas you should avoid. Inside of Burbank you are pretty good. Outside of Burbank you want to avoid the areas with the drawn-in red lines. Basically, you want to avoid going into the northern part of North Hollywood.
Final Thoughts
Burbank is a very safe city to visit and it is one of the safest areas of Los Angeles. There’s not really a bad area of Burbank that you should avoid, but you should be careful about wandering into certain section of North Hollywood at night.
Quick Facts About Burbank
Fact
Burbank, California
United States
Population, Census, April 1, 2020
107,337
331,449,281
Population, Census, April 1, 2010
103,340
308,745,538
White alone, percent
71.8%
76.3%
Black or African American alone, percent
3.0%
13.4%
American Indian and Alaska Native alone, percent
0.8%
1.3%
Asian alone, percent
12.1%
5.9%
Native Hawaiian and Other Pacific Islander alone, percent
0.0%
0.2%
Hispanic or Latino, percent
23.5%
18.5%
White alone, not Hispanic or Latino, percent
56.9%
60.1%
Foreign born persons, percent, 2015-2019
31.7%
13.6%
Owner-occupied housing unit rate, 2015-2019
41.9%
64.0%
Median value of owner-occupied housing units, 2015-2019
$730,100.00
$217,500.00
Median selected monthly owner costs -with a mortgage, 2015-2019
$2,864.00
$1,595.00
Median gross rent, 2015-2019
$1,692.00
$1,062.00
Households, 2015-2019
41,797
120,756,048
High school graduate or higher, percent of persons age 25 years+, 2015-2019
92.0%
88.0%
Bachelor’s degree or higher, percent of persons age 25 years+, 2015-2019
42.3%
32.1%
In civilian labor force, total, percent of population age 16 years+, 2015-2019
66.2%
63.0%
Total accommodation and food services sales, 2012 ($1,000)
532,939
708,138,598
Median household income (in 2019 dollars), 2015-2019
$75,827.00
$62,843.00
Per capita income in past 12 months (in 2019 dollars), 2015-2019
")
")

")
")
")
")
")
")
Leave a Reply