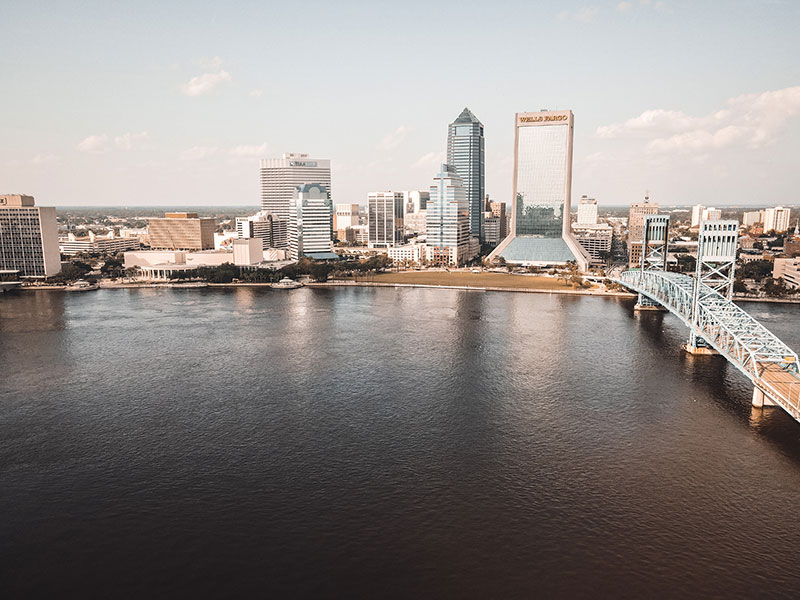
If you are thinking about visiting Jacksonville and have some qualms about the safety of the city, we got you covered.
We are going to deep dive into the statistics, look at some maps, graphs and talk to the residents of the city to give you a better understanding of how safe Jacksonville really is.
Is Jacksonville, Florida Safe To Visit?
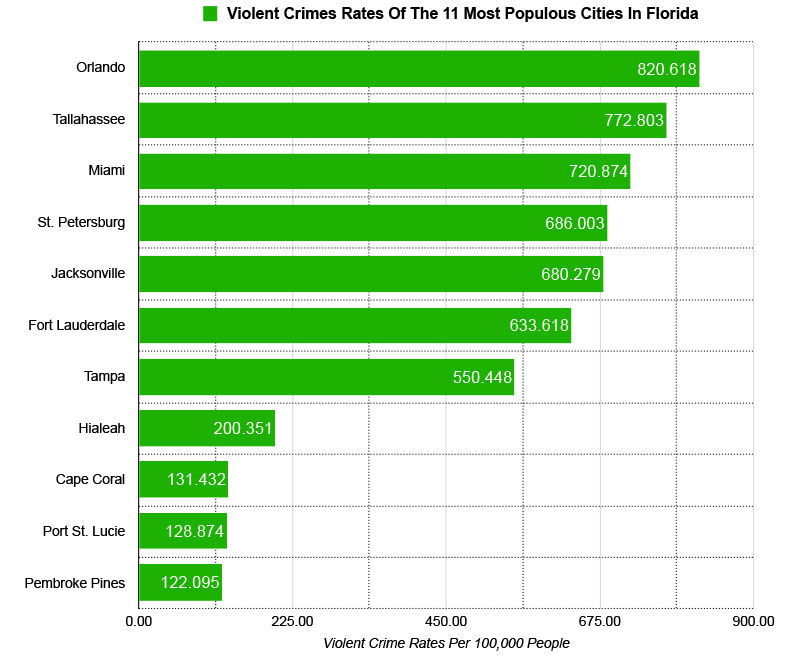
Statistically speaking, Jacksonville is a moderately safe place to visit. In 2020, Jacksonville’s violent crime rate ranked 40th at 680.29 incidents per 100,000 residents and it’s property crime rank ranked 70th at 2,783.46 per 100,000 residents.
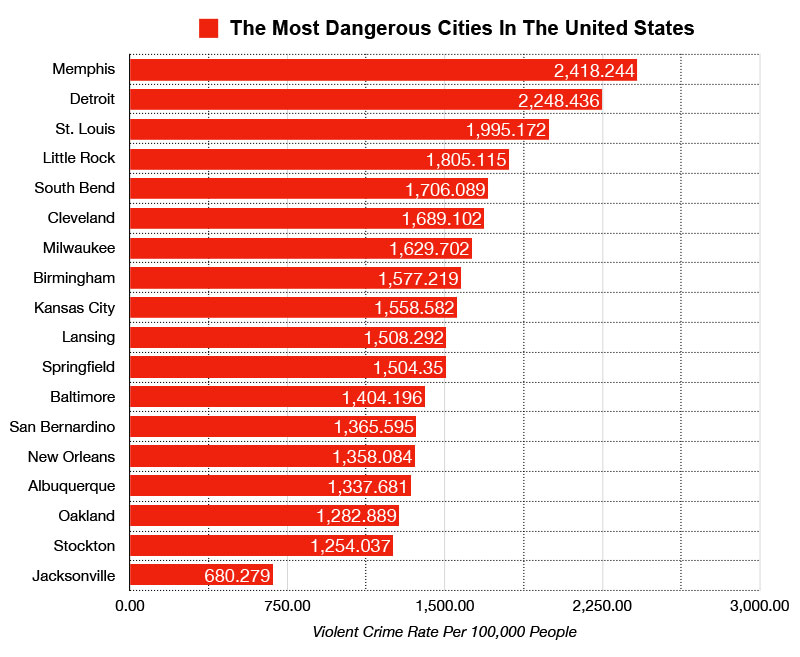
To put that in perspective, Memphis had the highest violent crime rate in 2020 at 2418.24 per 100,000 people. Jacksonville’s violent crime rate is 3.6 times less than Memphis.
Jacksonville’s Population
The population for the Jacksonville in 2020 was 949,611
Jacksonville, Florida Crime Stats
Here’s a breakdown of all the crimes in Jacksonville for 2019 and 2020.
In 2020 Jacksonville reported 6,460 violent crimes and had a violent crime rate of 680.28 per 100,000 people.
Jacksonville violent crime rate is the highest it has ever been since 2009.
The national average for violent crime is 398.5 per 100,000 residents. Jacksonville’s violent crime rate is 1.7 times greater than the national average.
Florida’s violent crime rate is 383.6 per 100,000. Jacksonville’s violent crime rate is 1.76 times greater than the state national average.
Year over year violent crime in Jacksonville has increased by 9%.
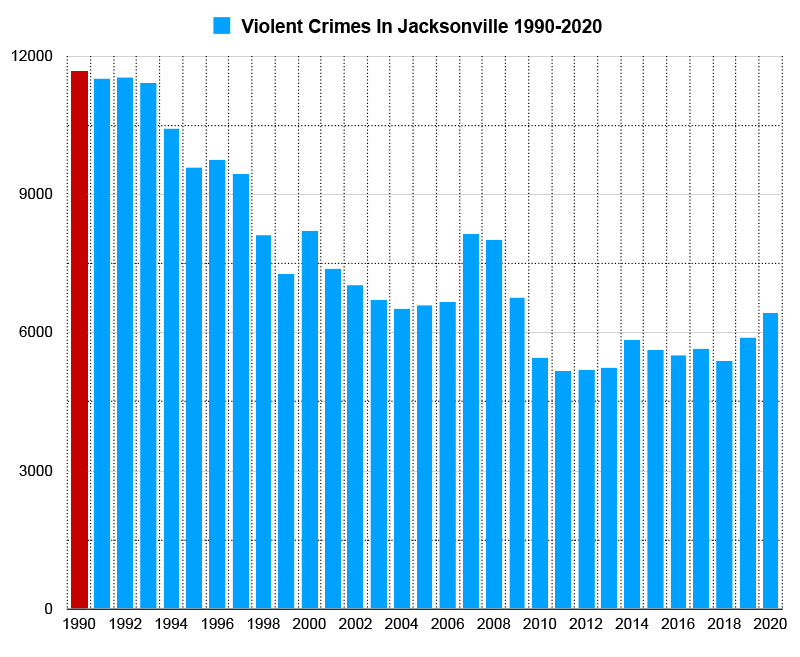
Here’s a map showing you how violent crime has trended in Jacksonville over a 30 year period. Violent crime peaked in 1990 when there were 11,654 violent crimes reported and the city had a violent crime rate of roughly 1,835.15 per 100,000 people.
*Violent crimes include; homicides, rape, robbery and aggravated assaults and the violent crime rate is calculated by dividing the number of reported crimes by the total population; the result is multiplied by 100,000.
Jacksonville’s Property Crime Rate
In 2020 Jacksonville reported 26,432 property crimes and had a property crime rate of 2,783.46 per 100,000 people.
The national average for property crime is 1958.2 per 100,000 residents. Jacksonville’s property crime rate is 1.4 times greater the national average.
Florida’s property crime rate is 1769.2 per 100,000. Jacksonville’s property crime rate is 1.57 times greater than the state national average.
Property crime has decreased over 50% from it’s 30-year high in 1995.
Year over year property crime in Jacksonville has decreased by 12%.
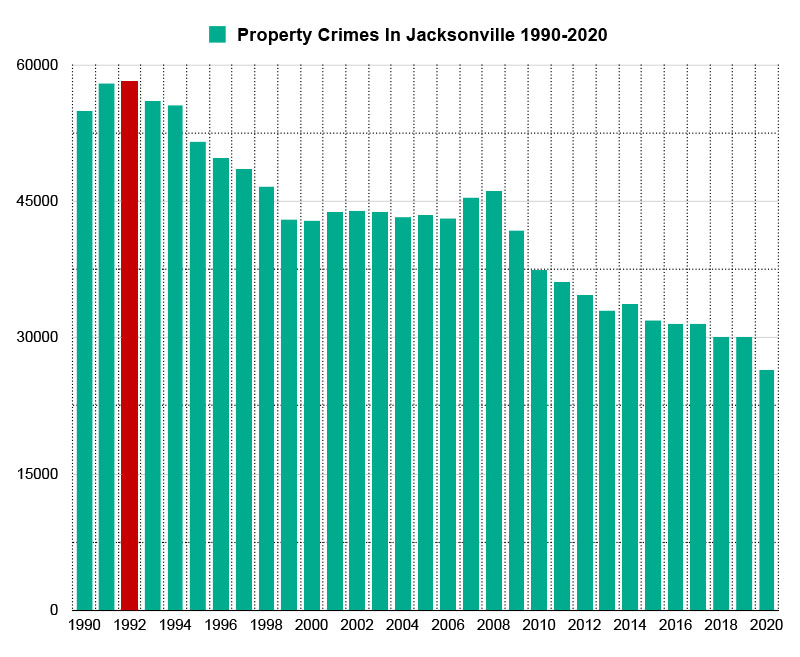
Here’s a map showing you how property crime has trended in Jacksonville over a 30 year period. Property crime peaked in 1992 when there were 58,229 property crimes reported and the city had a property crime rate of roughly 9169.3 per 100,000 people.
**Property crimes include; arson, burglary, larceny-theft, and motor vehicle theft are classified as property crimes. The property crime rate is calculated by dividing the number of reported crimes by the total population; the result is multiplied by 100,000.
Jacksonville’s Murder Stats
In 2020 Jacksonville reported 176 homicides, which was a staggering 10% increase over 2019, where 160 homicides were reported.
In 2020 Jacksonville had a murder rate of 18.53 per 100,000 residents.
176 homicides is the most amount of homicides reported in Jacksonville in the last 30 years. The last time homicides were this high was in 1990.
The national murder rate is 6.5 per 100,000 people. Jacksonville’s murder rate is 2.85 times greater the national average.
As of November 30, 2021, there have been 103 homicides reported and this is significantly less than last year at the same time.
Jacksonville vs The Most Dangerous Cities In The United States
Here’s a list of the top 17 most dangerous cities in the United States ranked by violent crime rates. Jacksonville’s violent crime rate is 3.6 times less than Memphis, the most dangerous city in the United States.
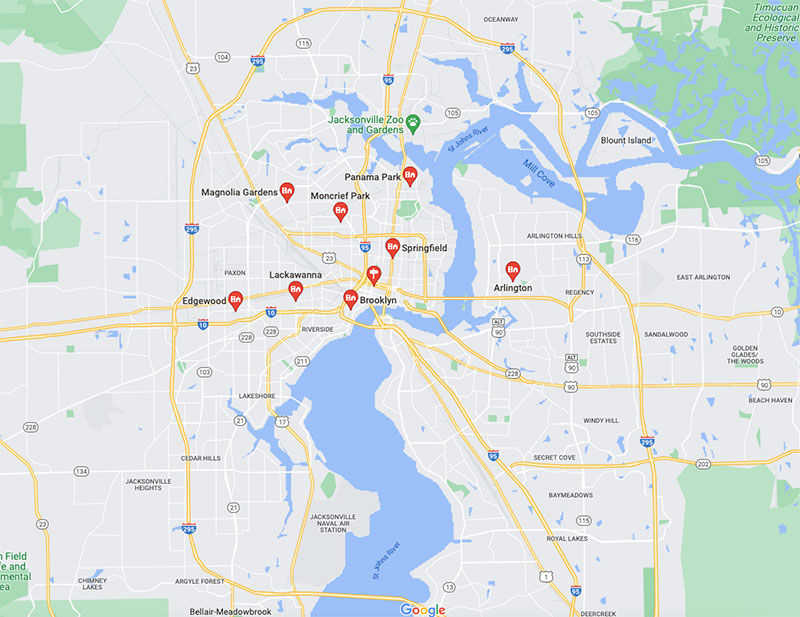
Downtown Jacksonville is not a safe area to visit, nor is it a place that has a lot attractions for visitors. There’s a lot of crime in the area and there is a lot of crime just north of it.
Many residents agree that Downtown Jacksonville is pretty much a ghost town unless there is a event in the area.
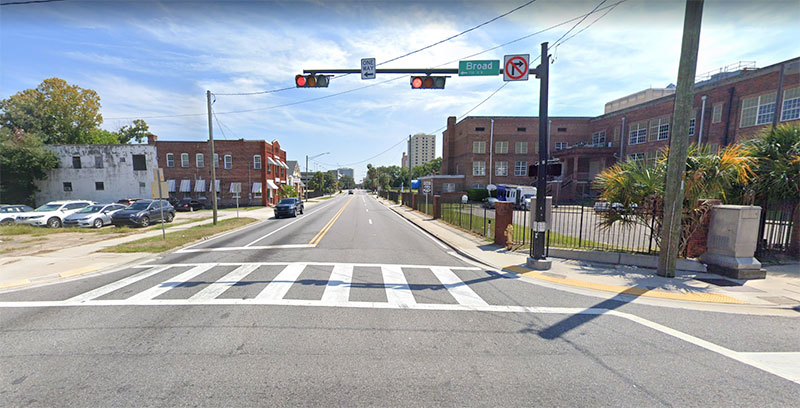
Tour of Downtown Jacksonville
What do residents of Jacksonville say about its safety
"I have lived here for more than 40 years and I would say that if you put a clock face on a map of Jacksonville with Downtown being the center, 3 o’clock west of Monument going counterclockwise to 6 o’clock north of Ortega Park"
"Jacksonville is filled with good and bad areas but generally the North and West are probably the sketchiest parts of the city."
"There are 5 main areas to Jacksonvillee: Northside, southside, westside, downtown and the beaches. The north and west side are generally considered the bad areas."
"When you hear the word ‘murder’ or ‘shooting’ in the news, it’s usually about a location in the northside or westside
"These zip codes are probably the most dangerous in Jacksonville: 32209, 32208, 32254."
"The southside, Mandarin and St. John’s are probably the safest areas of the city."
"Broad St. and Beaver St. is probably the most dangerous street in Jacksonville."
"If you divide Jacksonville into four quadrants with the I-10 as x-axis, and I-95 as your y-axis, then the majority of crime is located in the north-west quadrant. Lots of poverty and crime over there."
"North of Downtown and West of I-95 is a war zone."
"Not sure why people claim Jacksonville is dangerous. Look at the stats. It’s not high and its not incredibly low, its just average."
"Stay outta Arlington, Moncrief for SURE and anything downtown."
"The further south and east you are from downtown, the safer you are. The further north and west you are from downtown, the more dangerous it is. It eventually gets safer though."
"Generally speaking, east of the river is where most of the rough areas are and west of the river is generally nicer. There are exceptions though but I’m talking generally."
"Jacksonville is massive. There are safe areas and not so safe areas. The safer areas are generally in the south and the east."
Tips to stay safe while visiting Jacksonville
Always be aware of your surrounding. Don’t mindless scroll through your phone while walking down the street and don’t get lost in your headphones.
Learn the layout of the city and figure out which areas to avoid.
Don’t carry around large amounts of cash.
Avoid taking money out of the ATM at night and especially in areas that are sketchy.
Avoid walking around alone at night. Get an Uber or take a taxi to get to your destination.
Avoid engaging with homeless people and keep a safe distance away from them.
Plan out your routes beforehand to make sure you don’t end up in the wrong neighborhood late at night.
Don’t give out key details about where you are staying to strangers.
Download an offline map from Google on your phone, incase you get bad reception or no service on your phone.
Is Jacksonville safe for a woman?
Jacksonville is generally safe for women but we do not recommend that you walk alone at night in the dangerous areas mentioned above.
Is Jacksonville safe at night? / Is it safe to visit alone?
Jacksonville can be a safer place to visit if you study the layout of the city and avoid the problem areas and also follow the safety tips posted above.
Final Thoughts
Jacksonville is a moderately safe place to visit. It’s violent crime rate and property crime rate is not indicative of an unsafe city.
Just like any other big city, there are good areas and bad areas and if you can avoid the bad areas, you should be able to mitigate a lot of you chances of becoming a victim of crime.
Quick Facts About Jacksonville
Fact
Jacksonville, Florida
United States
Population, Census, April 1, 2020
949,611
331,449,281
Population, Census, April 1, 2010
821,784
308,745,538
Black or African American alone, percent
31.0%
13.4%
American Indian and Alaska Native alone, percent
0.2%
1.3%
Asian alone, percent
4.8%
5.9%
Native Hawaiian and Other Pacific Islander alone, percent
0.1%
0.2%
Two or More Races, percent
3.6%
2.8%
Hispanic or Latino, percent
10.0%
18.5%
White alone, not Hispanic or Latino, percent
51.2%
60.1%
Foreign born persons, percent, 2015-2019
11.3%
13.6%
Median value of owner-occupied housing units, 2015-2019
$173,200.00
$217,500.00
Median selected monthly owner costs -with a mortgage, 2015-2019
$1,366.00
$1,595.00
Median gross rent, 2015-2019
$1,065.00
$1,062.00
Households, 2015-2019
338,991
120,756,048
Language other than English spoken at home, percent of persons age 5 years+, 2015-2019
15.0%
21.6%
High school graduate or higher, percent of persons age 25 years+, 2015-2019
89.5%
88.0%
Bachelor’s degree or higher, percent of persons age 25 years+, 2015-2019
28.6%
32.1%
In civilian labor force, total, percent of population age 16 years+, 2015-2019
64.3%
63.0%
In civilian labor force, female, percent of population age 16 years+, 2015-2019
60.8%
58.3%
Median household income (in 2019 dollars), 2015-2019
$54,701.00
$62,843.00
Per capita income in past 12 months (in 2019 dollars), 2015-2019
")
")
")
")
")
")
")
")
")
Leave a Reply