If you are thinking about visiting Tallahassee and have some qualms about the safety of the city, we got you covered.
We are going to deep dive into the statistics, look at some maps, graphs and talk to the residents of the city to give you a better understanding of how safe Tallahassee really is.
Is Tallahassee Safe To Visit?
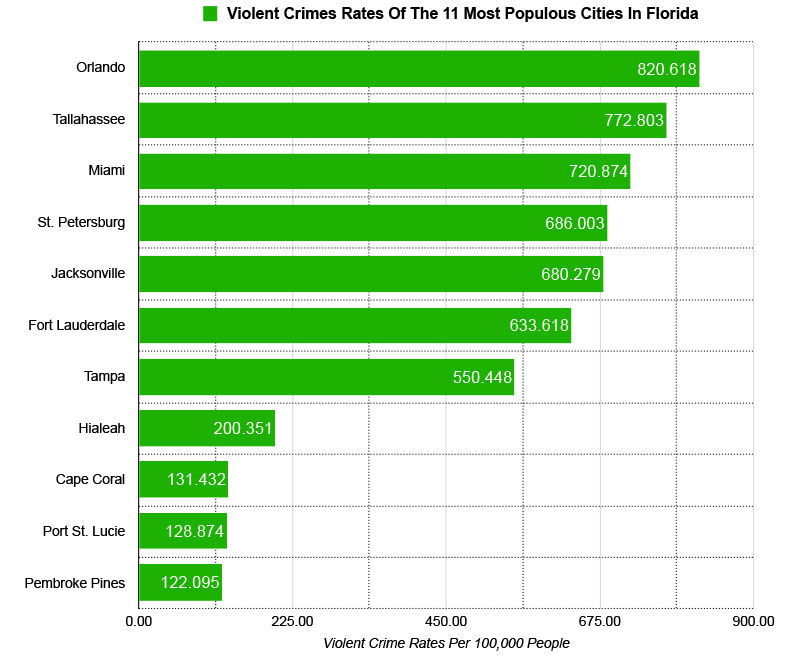
Statistically speaking, Tallahassee is a moderately safe place to visit. In 2020, Tallahassee’s violent crime rate ranked 32th at 772.80 incidents per 100,000 residents and it’s property crime rank ranked 68th at 2,949.50 per 100,000 residents.
Tallahassee has a similar violent crime rate to Dallas, Los Angeles, Phoenix and Orlando.
Tallahassee’s Population
The population for the Tallahassee in 2020 was 196,169
Tallahassee Crime Stats
Here’s a breakdown of all the crimes in Tallahassee for 2019 and 2020.
In 2020 Tallahassee reported 1,516 violent crimes and had a violent crime rate of 772.80 per 100,000 people.
The national average for violent crime is 398.5 per 100,000 residents. Tallahassee’s violent crime rate is 1.94 times greater than the national average.
Florida’s violent crime rate is 383.6 per 100,000. Tallahassee’s violent crime rate is 2 times greater than the state national average.
Year over year violent crime in Tallahassee has increased by 12%.
Tallahassee has a similar violent crime rate as Dallas, Phoenix and Los Angeles.
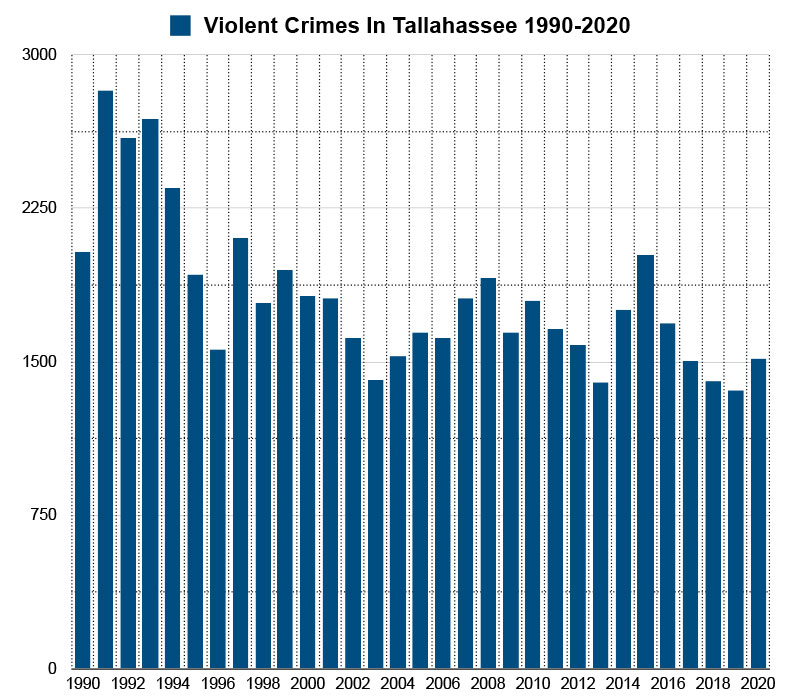
Here’s a map showing you how violent crime has trended in Tallahassee over a 30 year period. Violent crime peaked in 1991 when there were 2,826 violent crimes reported and the city had a violent crime rate of roughly 2,252.73 per 100,000 people. Violent crime has decreased over 46% from it’s 30-year high in 1991.
*Violent crimes include; homicides, rape, robbery and aggravated assaults and the violent crime rate is calculated by dividing the number of reported crimes by the total population; the result is multiplied by 100,000.
Tallahassee’s Property Crime Rate
In 2020 Tallahassee reported 5,786 property crimes and had a property crime rate of 2,949.50 per 100,000 people.
The national average for property crime is 1958.2 per 100,000 residents. Tallahassee’s property crime rate is 1.5 times greater the national average.
Florida’s property crime rate is 1769.2 per 100,000. Tallahassee’s property crime rate is 1.67 times greater than the state national average.
Year over year property crime in Tallahassee has decreased by 26%.
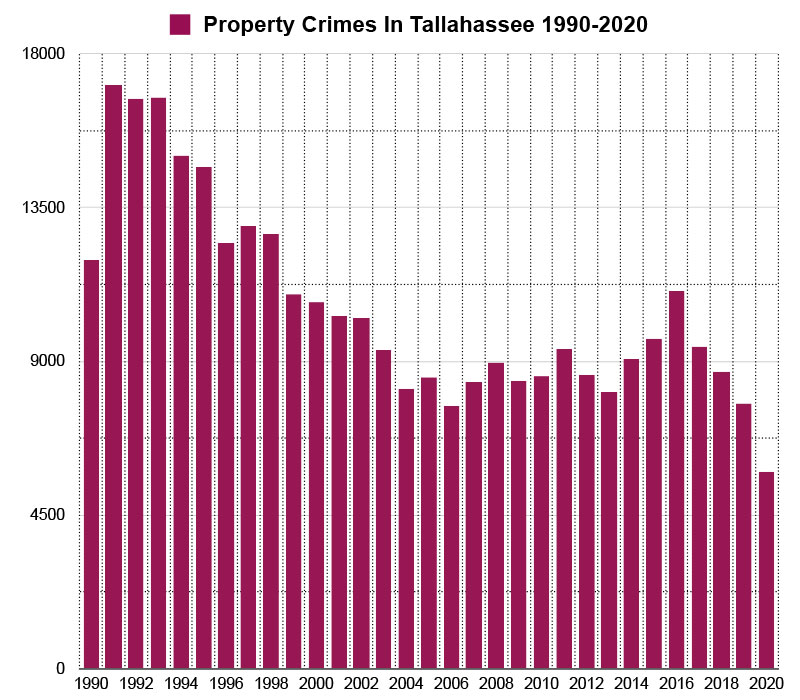
Here’s a map showing you how property crime has trended in Tallahassee over a 30 year period. Property crime peaked in 1991 when there were 17,106 property crimes reported and the city had a property crime rate of roughly 13,635.93 per 100,000 people. Property crime has decreased over 66% from it’s 30-year high in 1991.
**Property crimes include; arson, burglary, larceny-theft, and motor vehicle theft are classified as property crimes. The property crime rate is calculated by dividing the number of reported crimes by the total population; the result is multiplied by 100,000.
Tallahassee’s Murder Stats
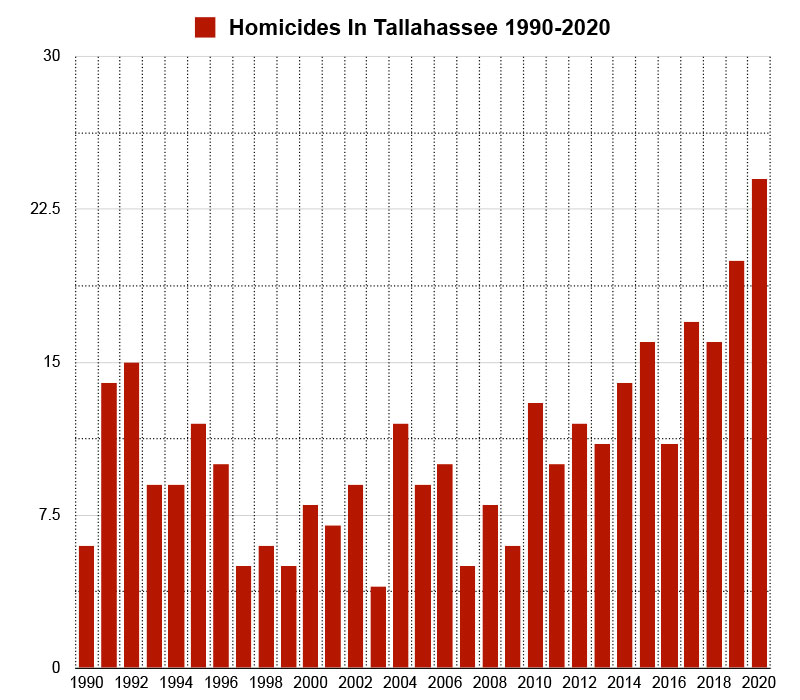
In 2020 Tallahassee reported 24 homicides, which was a 20% increase over 2019, where 20 homicides were reported.
In 2020 Tallahassee had a murder rate of 12.23 per 100,000 residents.
24 homicides is the most amount of homicides reported in Tallahassee in the last 30 years.
The national murder rate is 6.5 per 100,000 people. Tallahassee’s murder rate is 1.88 times greater the national average.
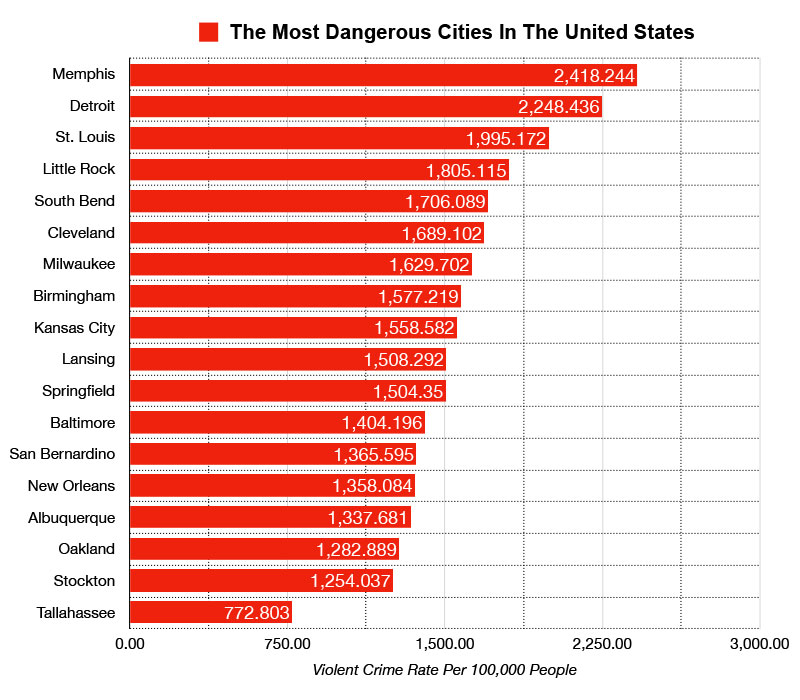
Tallahassee vs The Most Dangerous Cities In The United States
Here’s a list of the top 17 most dangerous cities in the United States ranked by violent crime rates. Tallahassee’s violent crime rate is 3.13 times less than Memphis, the most dangerous city in the United States.
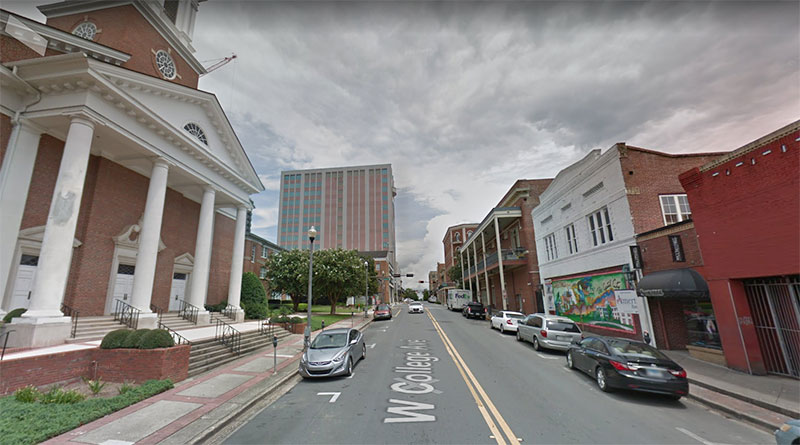
Downtown Tallahassee is generally a safe area to visit during the daytime, although there is not a lot going on in the area unless there is a big event.
What do residents of Tallahassee say about its safety
"Tallahassee has one of the highest visible police presences of any city I’ve been in. Between the TDP, the Leon Sheriff, FL Highway Patrol, FSU Police, FAMU Police, and Capitol Police you can’t drive more than six blocks without seeing some sort of law enforcement."
"Is there crime? Yes. Is it a warzone where your have to lock your doors and barricade yourself in? Absolutely NOT! "
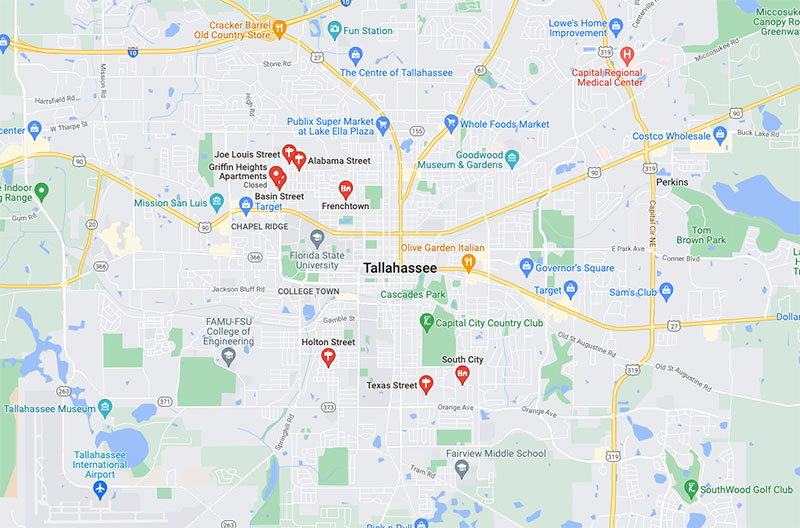
"Avoid the southside and westside and anywhere close to the campuses. Those are the most crime ridden and hectic areaas. Stay to the northeast."
"The further away you are from campus and the closer you are to the north side of town, the better you will be."
"Avoid the entire south side of town."
"Crimes in Tally tend to be concentrated in the ‘student zones’ and the westside of the city."
"Stay away from any street named after a state."
"Stick to the east side of town. East of Monroe. Crime is pretty bad near student housing and near the schools."
"There’s not a lot of RANDOM violent crime her. As long as you don’t get mixed up with drug dealers or gangs, you should be fine."
"Most of Tallahassee is very safe. The college population inflates the crimes rates on paper."
"The vast majority of Tally is very safe. The college kids tend to drive the crime rates up with their antics. The violent crime is pretty much concentrated in specific parts of the city that you are unlikely to find yourself in."
Tips to stay safe while visiting Tallahassee
Learn the layout of the city. Figure out which areas of the city are sketchy and avoid those areas.
Don’t walk around alone at night.
If you don’t go looking for trouble, trouble won’t go looking for you. Don’t get involved with drugs, gangs and other illicit activities.
Avoid the areas around the college campuses.
Don’t walk into a dark empty area at night. Avoid walking through alleys.
Always be aware of your surroundings.
Is Tallahassee safe for a woman?
Tallahassee is generally safe for women, but we do not recommend that you walk alone at night and especially in the dangerous areas mentioned above.
Is Tallahassee safe at night? / Is it safe to visit alone?
Tallahassee can be a safer place to visit if you study the layout of the city and avoid the problem areas and also follow the safety tips posted above.
Final Thoughts
Tallahassee is a moderately safe place to visit. It’s violent crime rate and property crime rate is not indicative of an unsafe city.
Just like any other big city, there are good areas and bad areas and if you can avoid the bad areas, you should be able to mitigate a lot of you chances of becoming a victim of crime.
Quick Facts About Tallahassee
Population, Census, April 1, 2020
196,169
331,449,281
Population, Census, April 1, 2010
181,376
308,745,538
Black or African American alone, percent
35.0%
13.4%
American Indian and Alaska Native alone, percent
0.2%
1.3%
Asian alone, percent
4.6%
5.9%
Native Hawaiian and Other Pacific Islander alone, percent
0.0%
0.2%
Two or More Races, percent
2.9%
2.8%
Hispanic or Latino, percent
6.7%
18.5%
White alone, not Hispanic or Latino, percent
51.1%
60.1%
Foreign born persons, percent, 2015-2019
8.1%
13.6%
Median value of owner-occupied housing units, 2015-2019
$203,800.00
$217,500.00
Median selected monthly owner costs -with a mortgage, 2015-2019
$1,459.00
$1,595.00
Median gross rent, 2015-2019
$1,023.00
$1,062.00
Language other than English spoken at home, percent of persons age 5 years+, 2015-2019
11.7%
21.6%
High school graduate or higher, percent of persons age 25 years+, 2015-2019
93.5%
88.0%
Bachelor’s degree or higher, percent of persons age 25 years+, 2015-2019
48.2%
32.1%
In civilian labor force, total, percent of population age 16 years+, 2015-2019
66.0%
63.0%
Total accommodation and food services sales, 2012 ($1,000)
593,028
708,138,598
Median household income (in 2019 dollars), 2015-2019
$45,734.00
$62,843.00
Per capita income in past 12 months (in 2019 dollars), 2015-2019
")
")
")
")
")
")
")
")
")
Leave a Reply