If you are thinking about visiting Beverly Hills and have some qualms about the safety of the city, we got you covered.
We are going to deep dive into the statistics, look at some maps, graphs and talk to the residents of the city to give you a better understanding of how safe Beverly Hills really is.
Is Beverly Hills Safe To Visit?
Beverly Hills is a safe place to visit. It’s one of the safest areas of Los Angeles and it’s crime rate is not indicative of a dangerous city.
In 2020, Beverly Hills had a violent crime rate of 339.44 incidents per 100,000 residents is on par with cities like San Diego, Anaheim and Laredo.
Beverly Hills’ Population
The population for the Beverly Hills in 2020 was 32,701.
Beverly Hills Crime Stats
Here’s a breakdown of all the crimes in Beverly Hills for 2019 and 2020.
In 2020 Beverly Hills reported 111 violent crimes and had a violent crime rate of 339.44 per 100,000 people.
The national average for violent crime is 398.5 per 100,000 residents. Beverly Hills’ violent crime rate is slightly less than the national average.
California’s violent crime rate is 442 per 100,000. Beverly Hills’ violent crime rate is .77 times less than the state national average.
Year over year violent crime has decreased 8%.
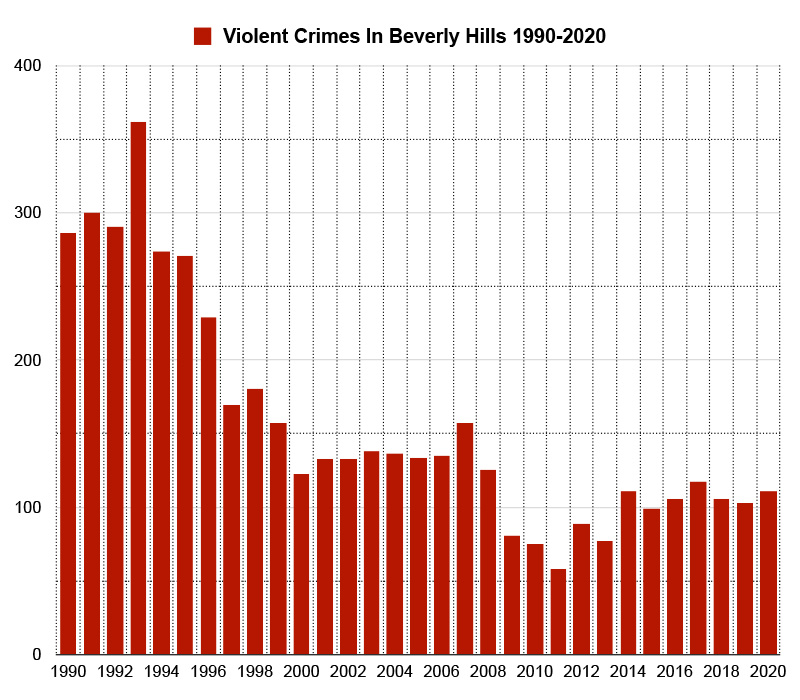
Here’s a map showing you how violent crime has trended in Beverly Hills over a 30 year period. Violent crime peaked in 1993 when there were 362 violent crimes reported and the city had a violent crime rate of roughly 1,131.25 per 100,000 people. Violent crime has decreased over 69% from it’s 30-year high in 1993.
*Violent crimes include; homicides, rape, robbery and aggravated assaults and the violent crime rate is calculated by dividing the number of reported crimes by the total population; the result is multiplied by 100,000.
Beverly Hills’ Property Crime Rate
In 2020 Beverly Hills reported 1,244 property crimes and had a property crime rate of 3,804.17 per 100,000 people.
The national average for property crime is 1958.2 per 100,000 residents. Beverly Hills’ property crime rate is 1.94 times greater the national average.
California’s property crime rate is 2138.9 per 100,000. Beverly Hills’ property crime rate is 1.78 times greater than the state national average.
Year over year property crime in Beverly Hills has decreased by 20%.
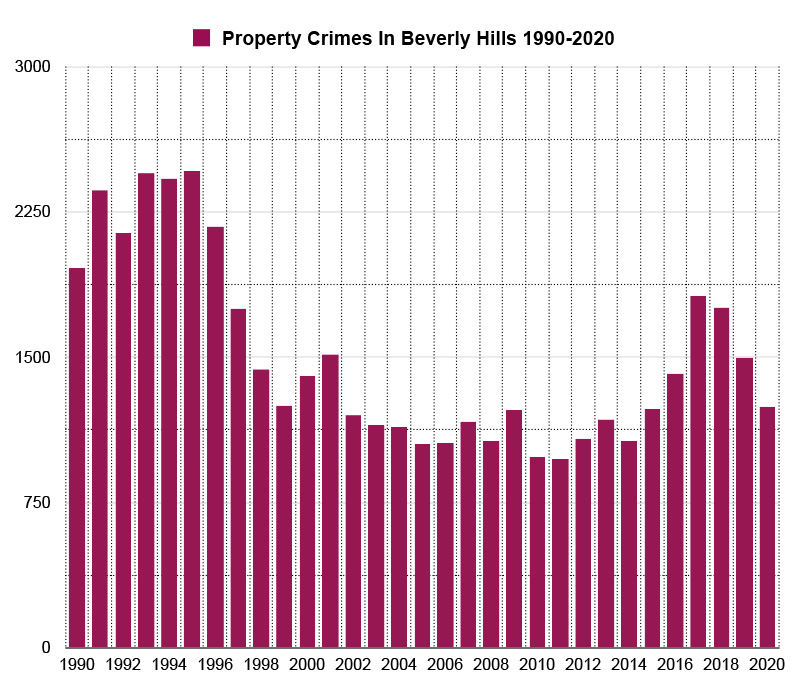
Here’s a map showing you how property crime has trended in Beverly Hills over a 30 year period. Property crime peaked in 1995 when there were 2,462 property crimes reported and the city had a property crime rate of roughly 7,693.75 per 100,000 people. Property crime has decreased over 49% from it’s 30-year high in 1995.
**Property crimes include; arson, burglary, larceny-theft, and motor vehicle theft are classified as property crimes. The property crime rate is calculated by dividing the number of reported crimes by the total population; the result is multiplied by 100,000.
Beverly Hills’ Murder Stats
In 2020 Beverly Hills reported 0 homicides, a 100% improvement from 2019 where 1 homicide was reported.
Beverly Hills vs Other California Cities
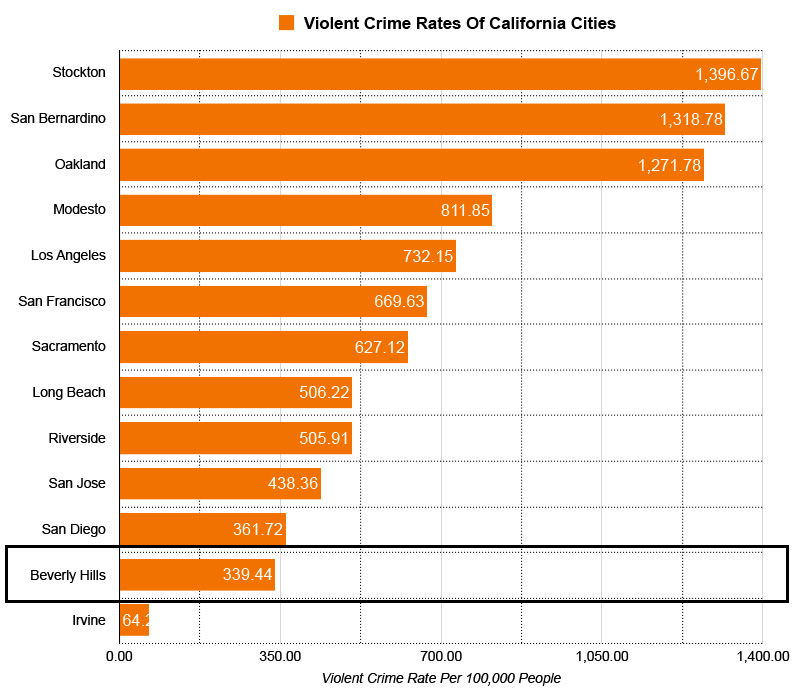
Here’s a graph showing you how Beverly Hills’ violent crime rate compares to other cities in California.
Beverly Hills’ violent crime rate is 4 times less than Stockton, the most dangerous city on the list.
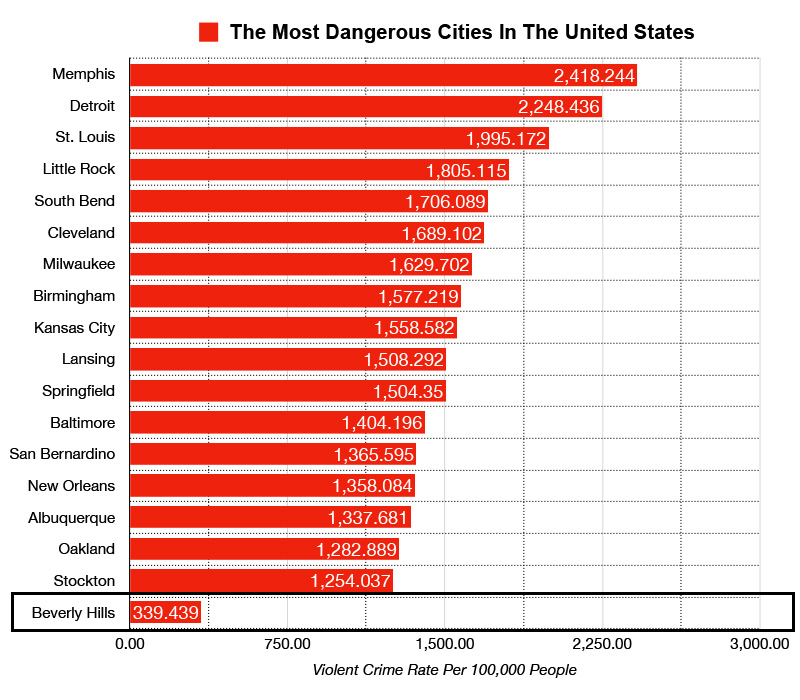
Beverly Hills vs The Most Dangerous Cities In The United States
Here’s a list of the top 17 most dangerous cities in the United States ranked by violent crime rates. Beverly Hills’ violent crime rate is 7 times less than Memphis, the most dangerous city in the United States.
What do residents of Beverly Hills say about its safety
Beverly Hills is one of the nicest and safest areas in Los Angeles. You won’t find a lot of transients, homeless or troublemakers in the area and the Beverly Hills police makes sure of it. They keep the riff-raff out and are focused on the area.
Beverly Hills is geared towards 3 types of people: Those who have zero tolerance for riff raff, very wealthy people and older people.
Beverly Hills is pretty darn safe. There are tons of cops everywhere and they are very responsive if you have a problem.
The most dangerous thing in Beverly Hills is the amount of damage your wallet will accrue. Everything is expensive af.
It’s one of the best neighborhoods in Los Angeles, in terms of cleanliness and safety. Other than that, its fairly pretentious.
Are There Any Bad Areas in Beverly Hills?
There are really no bad areas in Beverly Hills. You might encounter some rowdiness on Sunset Blvd on weekend nights but that’s about it. Keep in mind that crime can happen anywhere, so always be aware of your surroundings.
Is Beverly Hills Dangerous At Night?
Beverly Hills is generally safe day and night.
Is Beverly Hills Safe For A Woman?
Beverly Hills is safe for woman traveling alone. As long as you avoid walking in deserted areas at night and stay on well lit streets and be mindful of your surroundings, you should be fine.
Final Thoughts
Beverly Hills is perfectly safe and has a lot to offer in terms of restaurants, bars, shopping and attractions. It’s violent crime rate is not indicative of an unsafe city, however it does have a property crime issue, so cautious of your beloings.
Quick Facts About Beverly Hills
Population, Census, April 1, 2020
32,701
331,449,281
Population, Census, April 1, 2010
34,109
308,745,538
Persons under 18 years, percent
20.3%
22.3%
Persons 65 years and over, percent
21.4%
16.5%
Black or African American alone, percent
1.9%
13.4%
American Indian and Alaska Native alone, percent
0.2%
1.3%
Asian alone, percent
9.1%
5.9%
Two or More Races, percent
4.9%
2.8%
Hispanic or Latino, percent
5.9%
18.5%
White alone, not Hispanic or Latino, percent
77.8%
60.1%
Foreign born persons, percent, 2015-2019
34.1%
13.6%
Median value of owner-occupied housing units, 2015-2019
$2,000,000.00
$217,500.00
Median selected monthly owner costs -with a mortgage, 2015-2019
$4,000.00
$1,595.00
Median gross rent, 2015-2019
$2,244.00
$1,062.00
Language other than English spoken at home, percent of persons age 5 years+, 2015-2019
42.0%
21.6%
High school graduate or higher, percent of persons age 25 years+, 2015-2019
96.1%
88.0%
Bachelor’s degree or higher, percent of persons age 25 years+, 2015-2019
63.2%
32.1%
In civilian labor force, total, percent of population age 16 years+, 2015-2019
60.9%
63.0%
In civilian labor force, female, percent of population age 16 years+, 2015-2019
51.5%
58.3%
Median household income (in 2019 dollars), 2015-2019
$106,936.00
$62,843.00
Per capita income in past 12 months (in 2019 dollars), 2015-2019

")
")
")
")
")
")
")
")
Leave a Reply