If you are thinking about visiting Canton and have some qualms about the safety of the city, we got you covered.
We are going to deep dive into the statistics, look at some maps, graphs and talk to the residents of the city to give you a better understanding of how safe Canton really is.
Is Canton, Ohio Safe To Visit?
Statistically speaking, Canton is a unsafe place to visit. Violent crimes are 3.6x higher than the national average. Property crimes are 2.5x higher than the national average. Murders are 3x the national average.
Out of the 100 most populous cities in the United States, Canton’s violent crime rate ranks 14th highest.
In 2020, Canton had a violent crime rate of 1,415.23 per 100,000 people and is on par with cities like Baltimore, Kansas City and New Orleans.
Canton, Ohio Crime Stats
Here’s a breakdown of all the crimes in the city for 2020 compared to 2019:
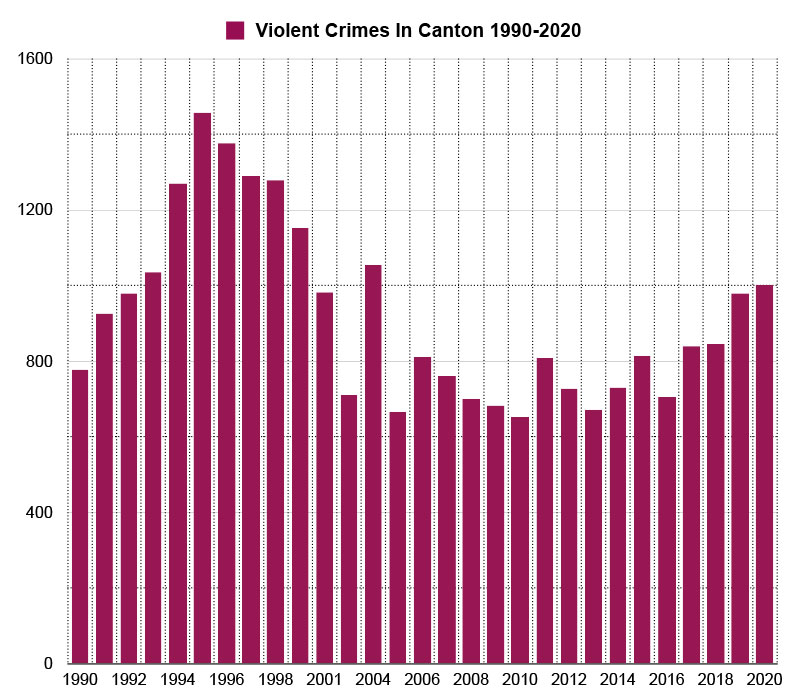
In 2020 Canton reported 1,003 violent crimes and had a violent crime rate of 1,415.23 per 100,000 people.
The national average for violent crime is 398.5 per 100,000 residents. Canton ’s violent crime rate is 3.6 times greater than the national average.
Year over year violent crime has increased by 2%.
Here’s a map showing you how violent crime has trended in Canton over a 30 year period.
Violent crime peaked in 1995 when there were 1,459 violent crimes reported and the city had a violent crime rate of roughly 1,779.27 per 100,000 people.
Violent crime has decreased over 31% from it’s 30-year high in 1995. Although it is steadily rising from 30 year low in 2005.
*Violent crimes include; homicides, rape, robbery and aggravated assaults and the violent crime rate is calculated by dividing the number of reported crimes by the total population; the result is multiplied by 100,000.
Canton ’s Property Crime Stats
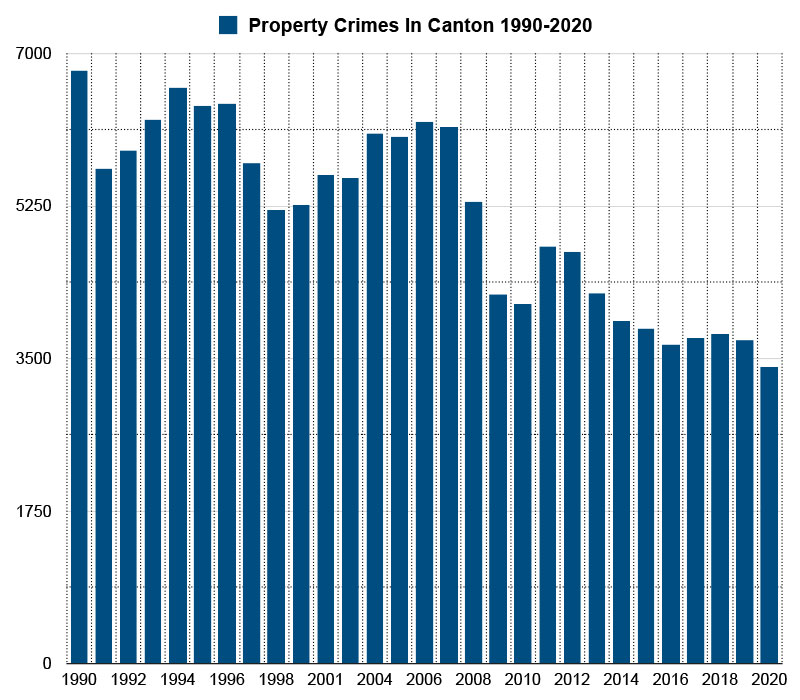
In 2020 Canton reported 3,411 property crimes and had a property crime rate of 4,812.90 per 100,000 people.
The national average for property crime is 1958.2 per 100,000 residents. Canton ’s property crime rate is 2.46 times greater the national average.
Year over year property crime in Canton has decreased by 9%.
Here’s a map showing you how property crime has trended in Canton over a 30 year period.
Property crime peaked in 1990 when there were 6,804 property crimes reported and the city had a property crime rate of roughly 8,297.56 per 100,000 people.
Property crime has decreased over 50% from it’s 30-year high in 1991.
*Property crimes include; burglary, larceny-theft, motor vehicle theft, and arson and property crime rate is calculated by dividing the number of reported crimes by the total population; the result is multiplied by 100,000.
Canton ’s Murder Stats
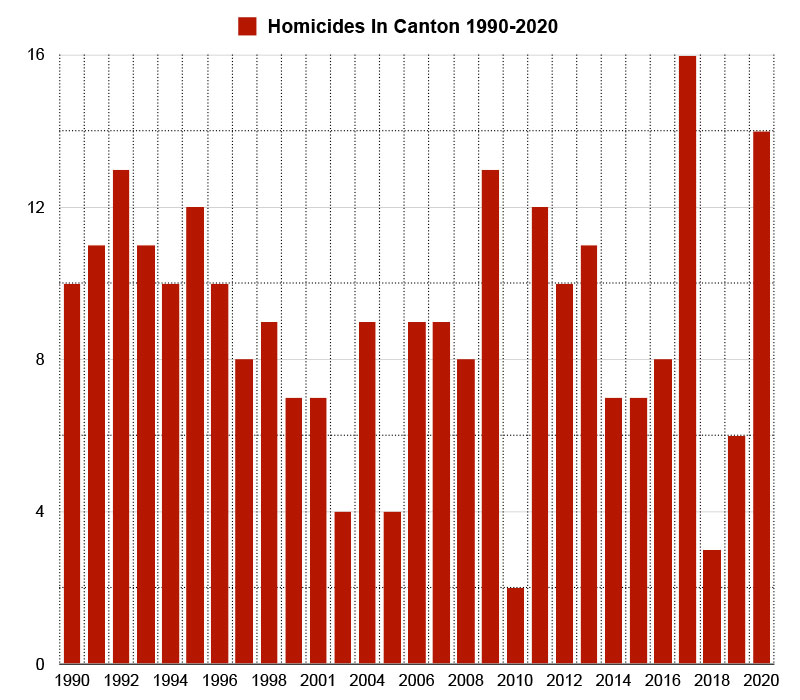
In 2020, Canton reported 14 homicides, a 133% increase over 2019, where 6 homicides were reported.
14 homicides is the second most amount of homicides reported in Canton in 30 years. In 2017 Canton reported 16 homicides.
In 2020 Canton had a homicide rate of 19.6 per 100,000 people.
Canton ‘s murder rate is 3 times greater than the national average.
As of Sept 15, 2021, Canton has already reported 15 homicides and is on pace to set a new record for homicides in the city.
Canton vs The Rest Of Ohio
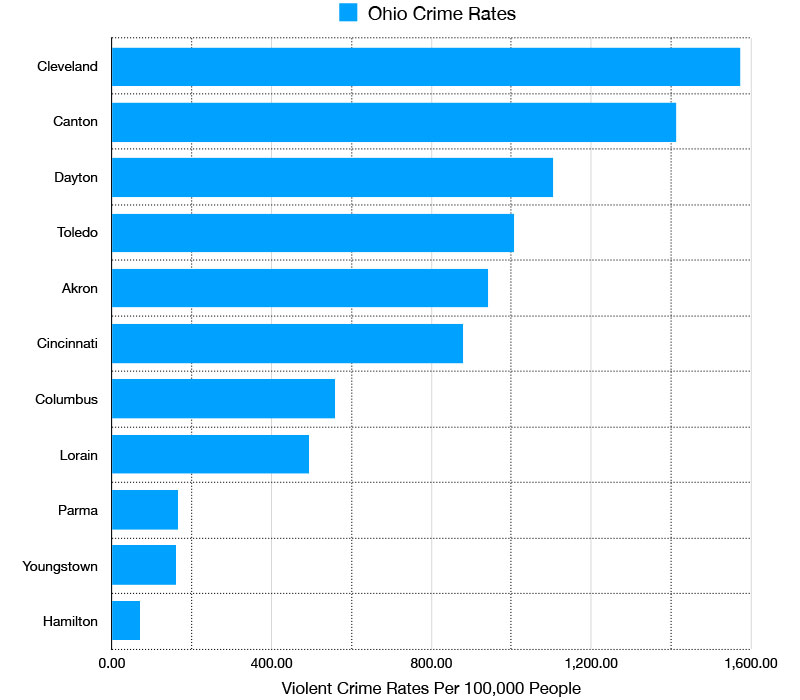
Here’s a graph showing you the violent crime rates of the 11 most populous cities in Ohio. Canton had the 2nd highest violent crime rate in the state.
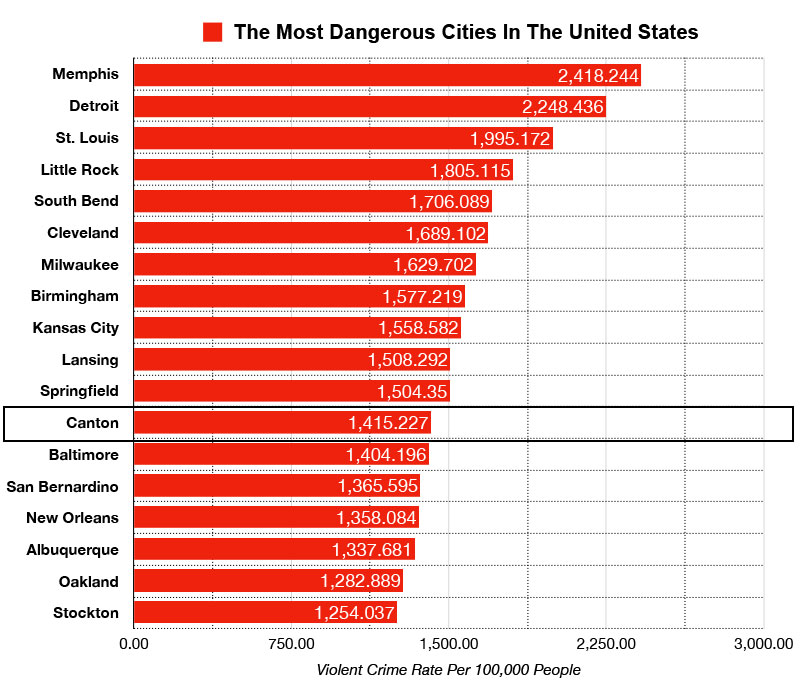
Canton, Ohio vs The Most Dangerous Cities in the United States
Here’s a list of the top 17 most dangerous cities in the United States ranked by violent crime rates. Canton’s violent crime rate ranks 12th highest. It’s violent crime rate is 1.7 times less than Memphis, the most dangerous city on the list.
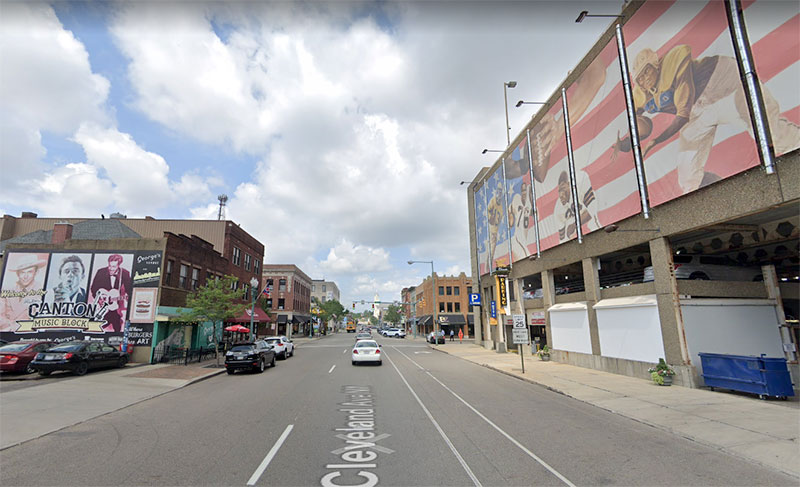
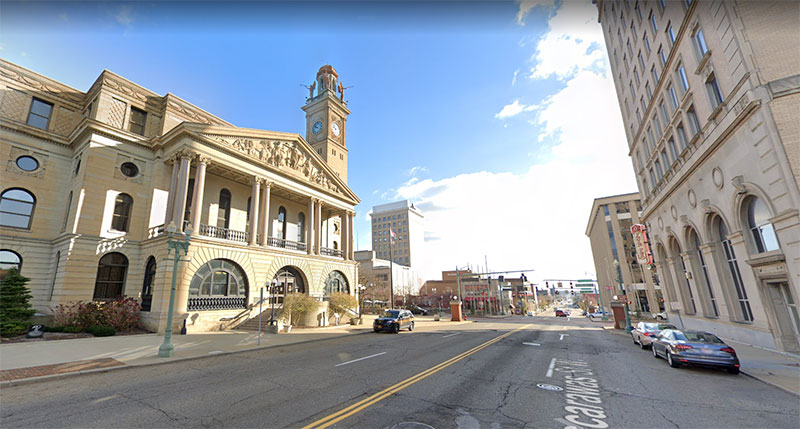
Downtown Canton is a generally safe area to visit during the daytime and as long as you stay within main area of downtown. We recommend that you stay within the vicinity of the downtown area, as the areas get sketchier as you move further away from it.
What do residents think of Downtown Canton:
"It is safe as long as you stay within the city center and don’t stray too far."
"For years downtown was terrible. So it’s hard to get that out of people’s minds."
"My mother-in-law lives in downtown Canton off the east side and she hears gunshots nightly."
"I’ve been mugged in downtown canton in the arts district. I’ve had my car broken into, and my mother was held up and the arts district is supposed to be one of the ‘better areas’."
"Downtown canton is a bit sketchy. I don’t really go to downtown very much, but when I do I make sure my doors are locked and keep an eye out for a potential issue."
" Downtown Canton has some nice areas, but places are still kind of dangerous."
"Downtown is miles better than it was 10-15 years ago and the transformation has been amazing, but there are still some rough areas."
"Downtown itself is safe, but some of the surrounding neighborhoods, mostly south/south-west are sketchy."
"Avoid downtown, except for First Friday. On the first friday of the month, there’s always lots going on and people from all sorts of different crowds come together and enjoy live music/art, food trucks, etc. There’s lots of good restaurants like George’s (gourmet burgers) and Napoli’s (NY style pizza, pasta) and there some good music venues: Buzzbin is the spot if you’re into metal/punk/etc. If you do go downtown at night for any of the above, don’t wander far."
"Downtown is not bad. It’s mostly some of the surrounding neighborhoods. The sketchy neighborhoods are all within a few miles of downtown and are located to the southwest and northeast."
What do residents of Canton, Ohio say about it’s safety?
"North Canton is better than south. The lower-numbered streets tend to be worse than higher numbered streets. North of Tuscawarus and West of I-77 is ok. East of I-77 is ok once you’re north of US-62. The neighborhoods around Malone University are ok, but I would avoid going further south."
"Avoid downtown or anything south of it. The farther north you are, the better."
"Canton has been on the decline for 30+ years and the city is losing its population slowly."
" Canton is safer than it was in the 90s, but compared to just about anywhere locally? It’s just not as safe. Im not comfortable in labeling it safe yet, we’re still several years away from that."
"The city has been doing a lot to curb crime and fix things up, but it’s still worse than most of the neighboring communities."
"North Canton is great. South of that not so much."
"Unfortunately Canton is not a very nice city, the decline of manufacturing hit the city hard and has led to a poor economy along with a serious drug and crime problem."
"To the people not from here, Canton is probably a less than mediocre city with a disproportionate amount of crime."
Is Canton, Ohio Safe For Women?
Canton is safe for female solo travelers, as long as you learn the layout of the city, avoid problem areas, don’t walk alone at night and follow general precautionary measures.
Tips to stay safe while visiting Canton
Do you research before you travel here. Get to know your destination in depth before you arrive. Learn which neighborhoods you should avoid. Go on Google street-view and look at the area and get a feel if its within your comfort range.
Don’t walk around aimlessly at night. Drive, take a taxi or use ride sharing to get to your destination.
Save the sightseeing for the daytime.
Stay in well populated and well lit areas at night. Avoid going down alleys or desolate streets.
Always be aware of your surroundings. Keep your ears and eyes open. Keep your headphones off and don’t scroll aimlessly through your phone.
Don’t walk around alone at night. There is power in numbers.
Don’t be a walking advertisement. Don’t wear expensive watches, don’t carry an expensive purse and don’t carry around an expensive camera around your neck.
Quick Facts About Canton, Ohio
Fact
Canton, Ohio
United States
Population, Census, April 1, 2020
70,872
331,449,281
Population, Census, April 1, 2010
73,007
308,745,538
Black or African American alone, percent
24.8%
13.4%
American Indian and Alaska Native alone, percent
0.1%
1.3%
Asian alone, percent
0.5%
5.9%
Native Hawaiian and Other Pacific Islander alone, percent
0.0%
0.2%
Two or More Races, percent
6.0%
2.8%
Hispanic or Latino, percent
4.6%
18.5%
White alone, not Hispanic or Latino, percent
64.1%
60.1%
Median value of owner-occupied housing units, 2015-2019
$71,100.00
$217,500.00
Median selected monthly owner costs -with a mortgage, 2015-2019
$883.00
$1,595.00
Median gross rent, 2015-2019
$671.00
$1,062.00
High school graduate or higher, percent of persons age 25 years+, 2015-2019
86.1%
88.0%
Bachelor’s degree or higher, percent of persons age 25 years+, 2015-2019
13.9%
32.1%
Persons without health insurance, under age 65 years, percent
9.5%
10.2%
In civilian labor force, total, percent of population age 16 years+, 2015-2019
61.5%
63.0%
Median household income (in 2019 dollars), 2015-2019
$32,287.00
$62,843.00
Per capita income in past 12 months (in 2019 dollars), 2015-2019
")

")
")
")
")
")
")
")
Leave a Reply