To determine which cities in California are the most dangerous, we compiled data from the FBI’s Uniform Crime Report and sorted each city’s violent crime rate. Violent crimes include: murder, rape, robbery and aggravated assaults.
Violent crime rate is calculated by dividing the total numbers of violent crime by the total population; the result is multiplied by 100,000.
The California sate average for violent crime is 442 per 100,000 people and its state average for property crime is 2,138.9 per 100,000 people.
What Is The Most Dangerous City In California?
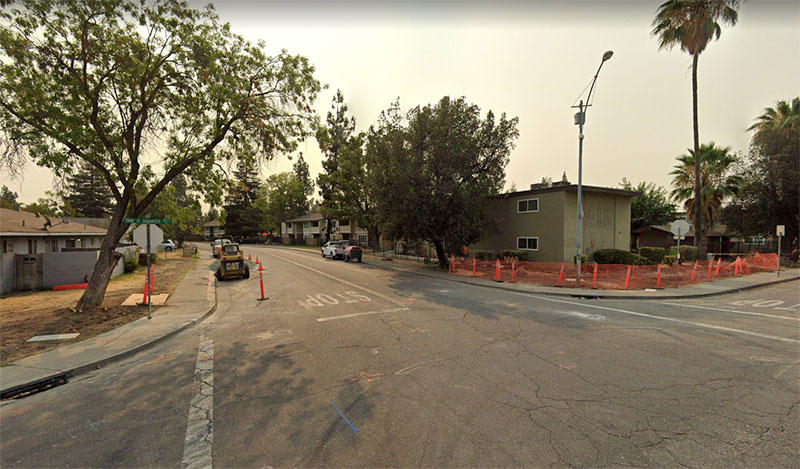
The most dangerous city in California is Stockton. In 2019, Stockton had a violent crime rate of 1,396.66 per 100,000 people and a property crime rate of 4,190.30.
Stockton’s violent crime rate is 3.2x greater than the state average. It’s property crime rate is almost twice the state average.
The Most Dangerous Cities In California VS The Safest City In California
Here’s a graph showing you the violent crime rates of the top 10 most dangerous cities in California and we also included the safest city in California, Irvine, to give you some perspective on the contrast in crime rates.
City
Population
Violent Crime Rate
Property Crime Rate
Stockton
313,604
1,396.666
3,943.51
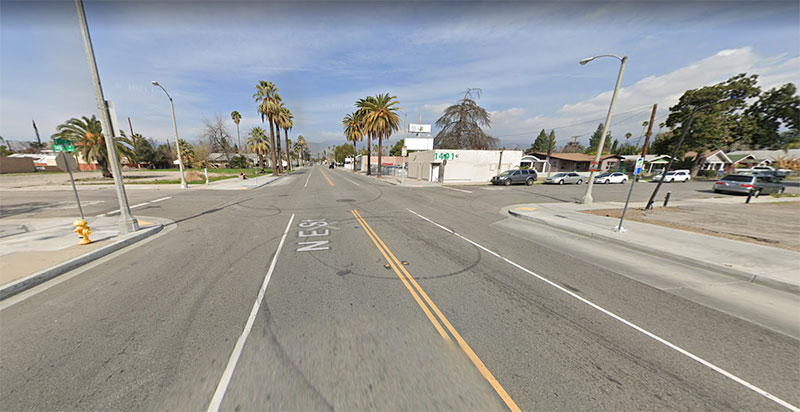
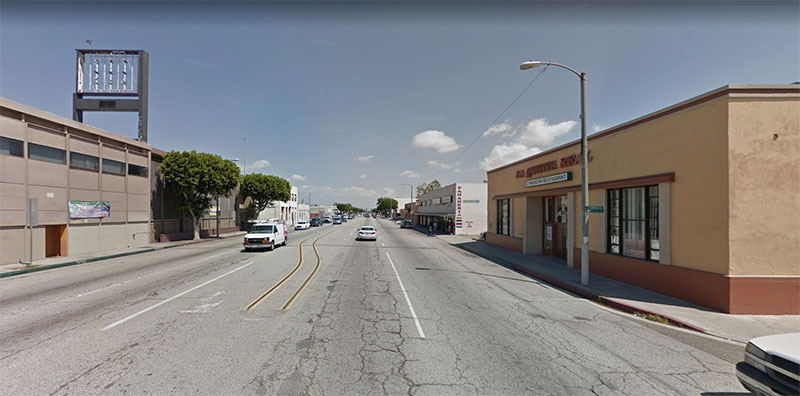
San Bernardino
216,715
1,318.783
4,190.30
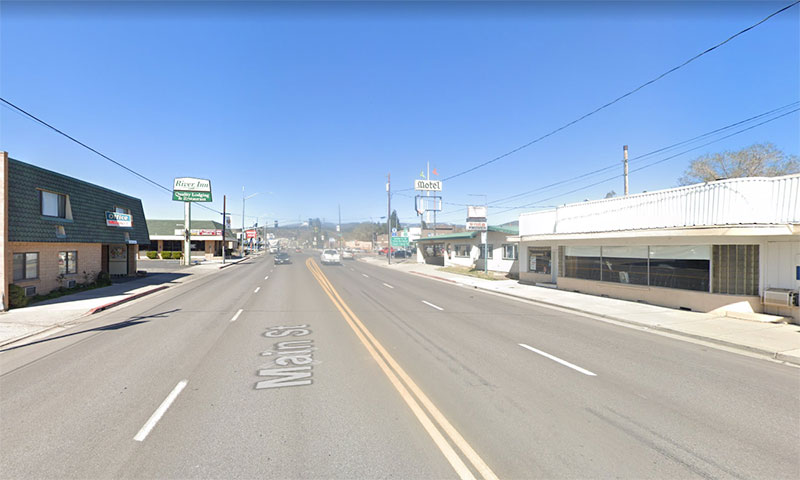
Susanville
14,878
1,317.381
1,391.32
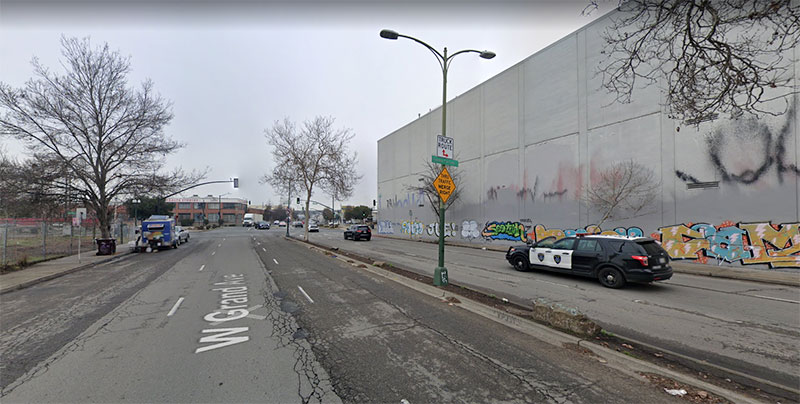
Oakland
434,036
1,271.784
6,420.67
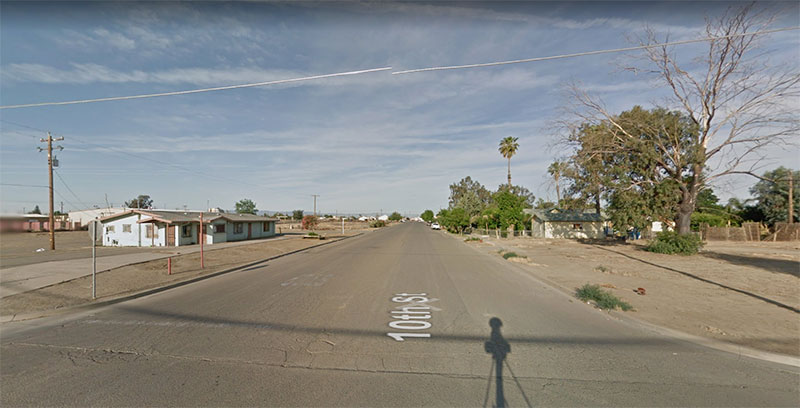
Dos Palos
5,594
1,144.083
3,021.09
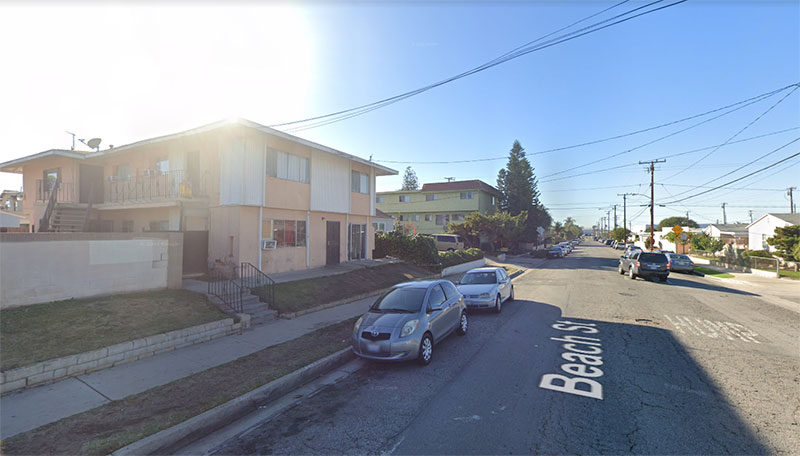
Compton
96,638
1,142.408
2,427.62
Barstow
24,121
1,135.940
4,087.72
Huron
7,359
1,127.871
760.97
Commerce
12,804
1,077.788
7,841.30
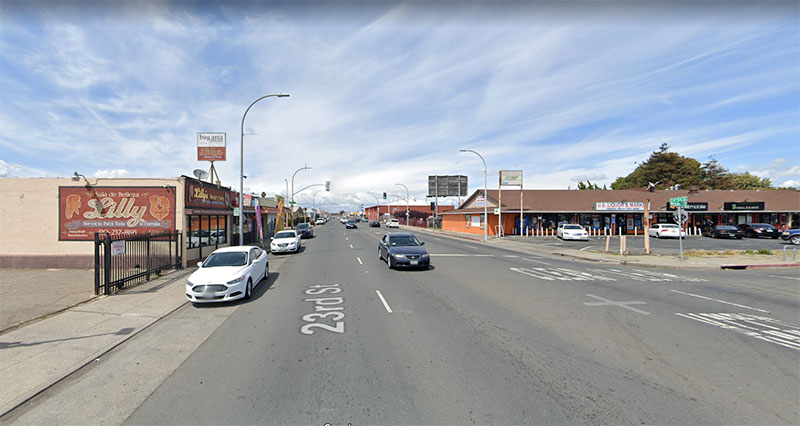
Richmond
110,988
931.632
3,773.38
Top 10 Most Dangerous Small-Sized Cities In California (Up To 50,000 People)
City
Population
Violent Crime Rate
1. Emeryville
12,380
1,340.87
2. Susanville
14,878
1,317.38
3. Weed
2,673
1,271.98
4. Dos Palos
5,594
1,144.08
5. Barstow
24,121
1,135.94
6. Huron
7,359
1,127.87
7. Commerce
12,804
1,077.79
8. Red Bluff
14,308
929.55
9. Marysville
12,572
922.69
10. Arvin
21,811
898.63
Top 10 Most Dangerous Medim-Sized Cities In California (50,000-200,000 People)
City
Population
Violent Crime Rate
1. Compton
96,638
1,142.41
2. Richmond
110,988
931.63
3. Lancaster
159,335
852.92
4. Vallejo
122,657
845.45
5. Victorville
123,089
802.67
6. Huntington Park
58,181
787.20
7. Hawthorne
87,305
728.48
8. Santa Monica
91,621
724.72
9. South Gate
94,445
658.58
10. Highland
55,686
650.07
Top 10 Most Dangerous Large Cities In California (200,000+ people)
City
Population
Violent Crime Rate
1. Stockton
313,604
1,396.67
2. San Bernardino
216,715
1,318.78
3. Oakland
434,036
1,271.78
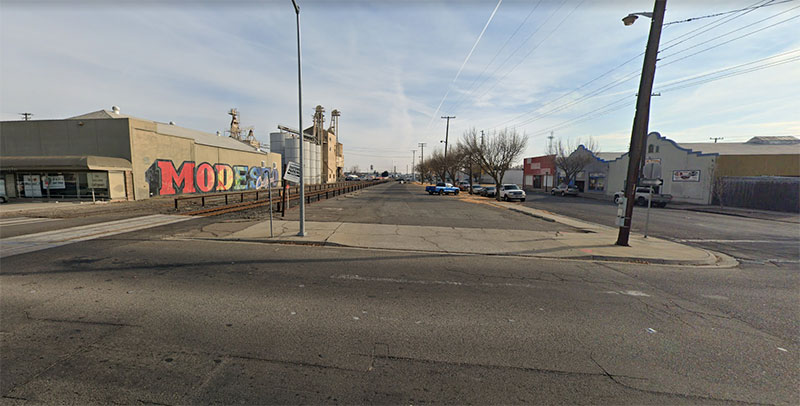
4. Modesto
216,542
811.85
5. Los Angeles
4,015,546
732.15
6. San Francisco
886,007
669.63
7. Sacramento
513,934
627.12
8. Long Beach
467,974
506.22
9. Riverside
333,260
505.91
10. Bakersfield
388,080
455.06
You might also be interested in these other states:


")
")
")
")
Leave a Reply