To determine which cities in California are the Safest, we compiled data from the FBI’s Uniform Crime Report and sorted each city’s violent crime rate. Violent crimes include: murder, rape, robbery and aggravated assaults.
Violent crime rate is calculated by dividing the total numbers of violent crime by the total population; the result is multiplied by 100,000.
The California state average for violent crime is 446.5 per 100,000 people and its state average for property crime is 2,245 per 100,000 people.
What Is The Safest City In California?
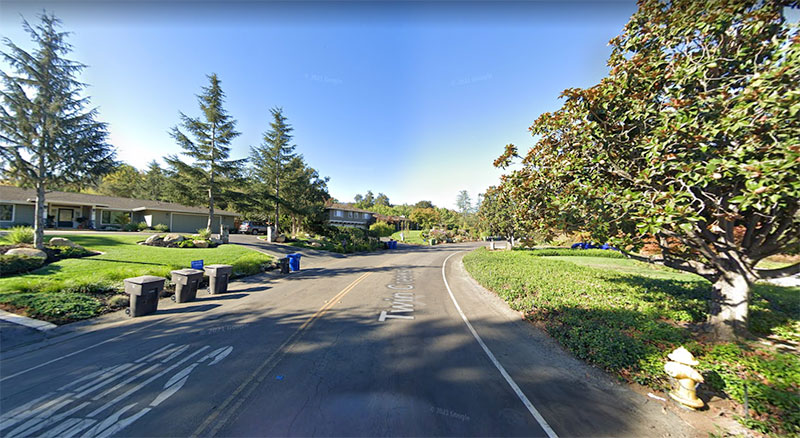
The safest city in California is Monte Sereno, a city located in Santa Clara county and southwest of San Jose.
In 2019, Monte Sereno had a violent crime rate of 0 per 100,000 people. There was no violent crime reported in the city in all of 2019. No murders, no rapes, no robberies and no aggravated assaults. Monte Sereno also only reported 12 property crimes in 2019 and had a property crime rate of 342.
Top 10 Safest Cities In California
1. Monte Sereno – 0.0 violent crimes per 100k
(map)
| Population in 2019 | 3,507 |
| Property Crime Rate | 340 |
| Median Household Income | $250,000+ |
| Per Capita Income | $150,687 |
| Median Property Value | $2M |
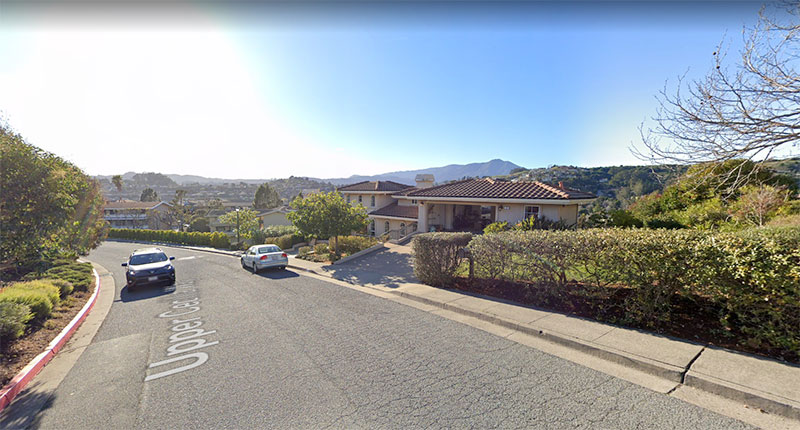
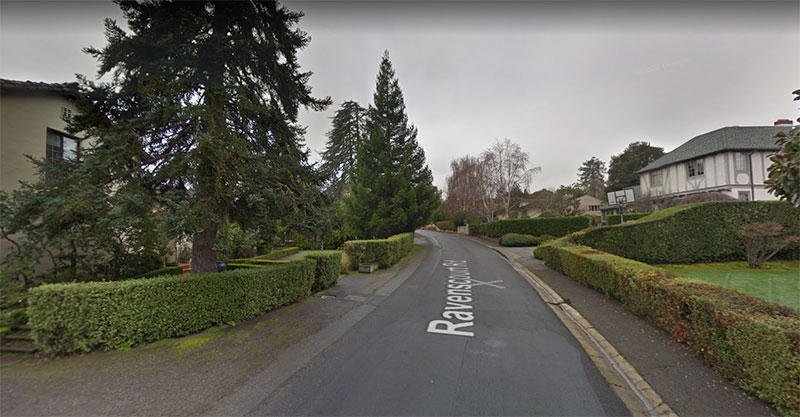
2. Tiburon – 0 violent crimes per 100k
(map)
| Population in 2019 | 9,135 |
| Property Crime Rate | 898 |
| Median Household Income | $154,915 |
| Per Capita Income | $112,368 |
| Median Property Value | $2M |
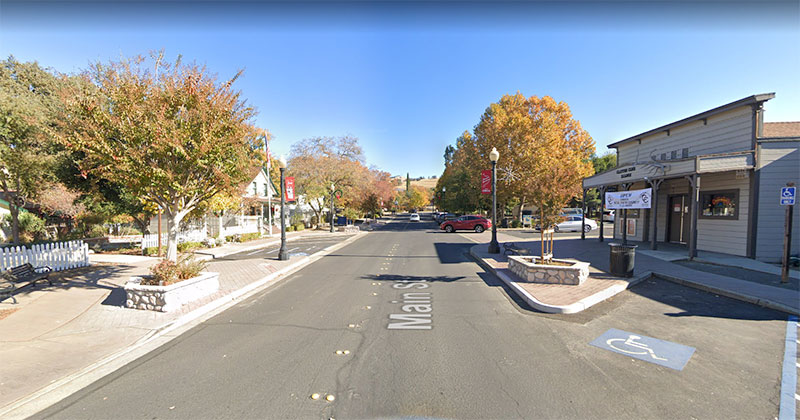
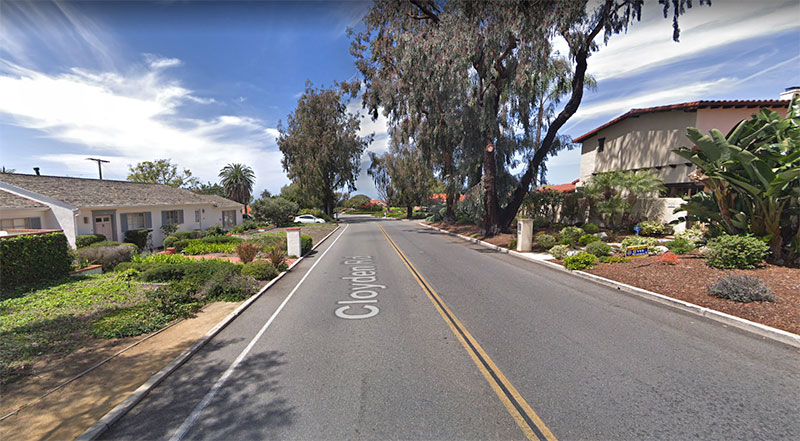
3. Clayton – 8.1 violent crimes per 100k
(map)
| Population in 2019 | 12,356 |
| Property Crime Rate | 1,254 |
| Median Household Income | $157,768 |
| Per Capita Income | $67,695 |
| Median Property Value | $771,400 |
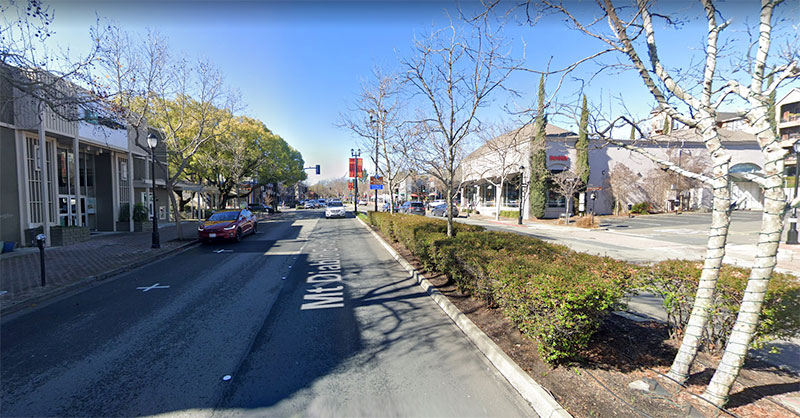
4. Lafayette – 14.9 violent crimes per 100k
(map)
| Population in 2019 | 26,872 |
| Property Crime Rate | 1,332 |
| Median Household Income | $178,889 |
| Per Capita Income | $91,274 |
| Median Property Value | $1.43M |
5. Palos Verdes Estates – 29.9 violent crimes per 100k
(map)
| Population in 2019 | 13,400 |
| Property Crime Rate | 657 |
| Median Household Income | $194,543 |
| Per Capita Income | $102,182 |
| Median Property Value | $2M |
6. Los Altos Hills– 34.8 violent crimes per 100k
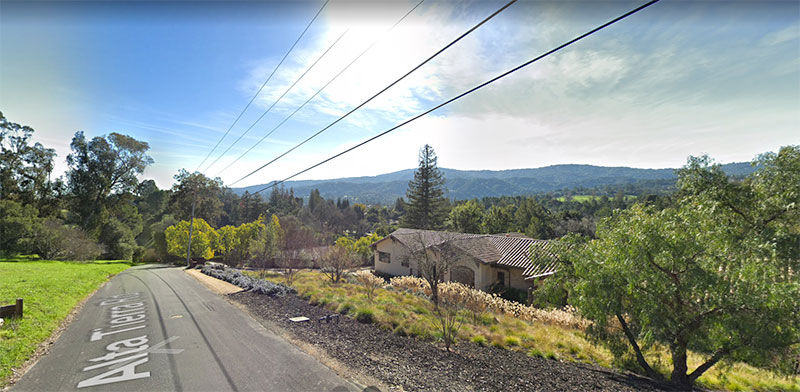
(map)
| Population in 2019 | 8,622 |
| Property Crime Rate | 777 |
| Median Household Income | $250,000+ |
| Per Capita Income | $153,175 |
| Median Property Value | $2M |
7. Coronado– 42.6 violent crimes per 100k
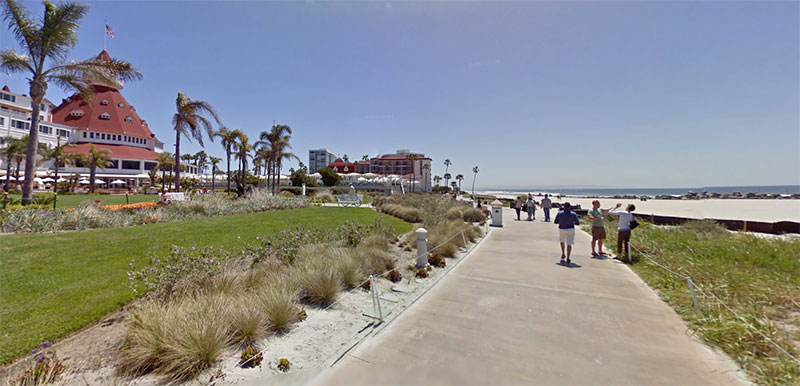
(map)
| Population in 2019 | 21,115 |
| Property Crime Rate | 1,534 |
| Median Household Income | $108,967 |
| Per Capita Income | $61,479 |
| Median Property Value | $1.62M |
8. Hillsborough– 43.4 violent crimes per 100k
(map)
| Population in 2019 | 4,663 |
| Property Crime Rate | 4,525.0 |
| Median Household Income | $250,000+ |
| Per Capita Income | $140,843 |
| Median Property Value | $2M |
9. Laguna Woods – 43.6 violent crimes per 100k
(map)
| Population in 2019 | 16,043 |
| Property Crime Rate | 773 |
| Median Household Income | $44,020 |
| Per Capita Income | $42,857 |
| Median Property Value | $288,400 |
10. Los Gatos – 45.5 violent crimes per 100k
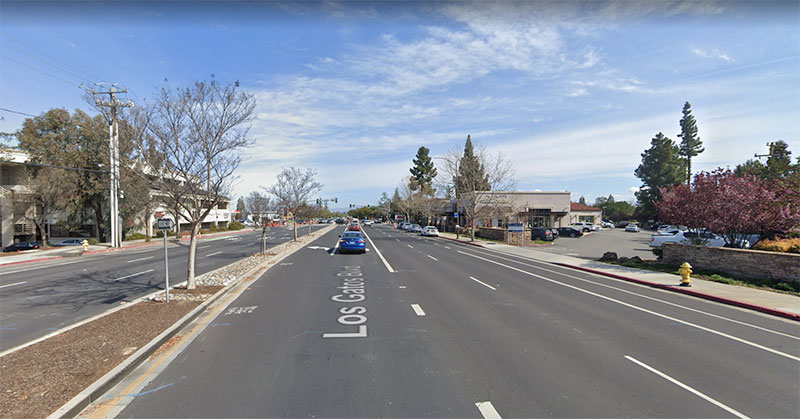
(map)
| Population in 2019 | 30,793 |
| Property Crime Rate | 1,361 |
| Median Household Income | $155,863 |
| Per Capita Income | $87,111 |
| Median Property Value | $1.69M |
Top 10 Safest Medim-Sized Cities In California (50,000-200,000 People)
|
City |
Population |
Violent Crime Rate |
|
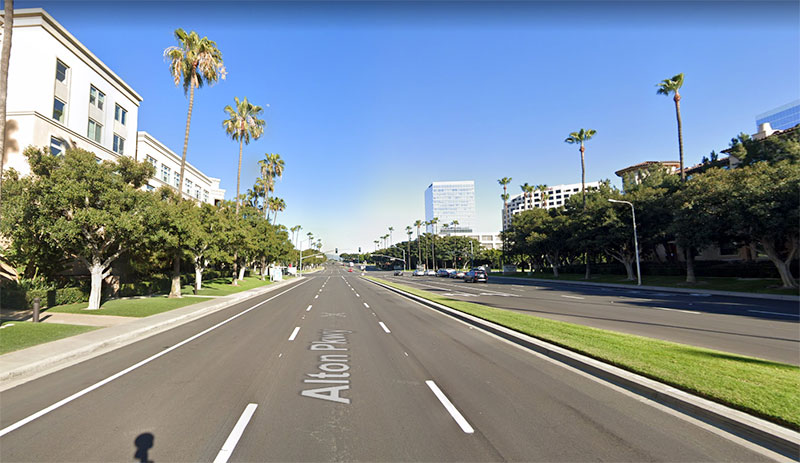
1. Aliso Viejo |
52,247 |
51.7 |
|
2. Yorba Linda |
68,225 |
61.6 |
|
3. Laguna Niguel |
66,671 |
64.5 |
|
4. Murrieta |
116,413 |
66.1 |
|
5. Mission Viejo |
95,453 |
68.1 |
|
6. Thousand Oaks |
127,811 |
68.9 |
|
7. San Ramon |
76,387 |
75.9 |
|
8. Lake Forest |
86,691 |
76.1 |
|
9. Camarillo |
69,628 |
83.3 |
|
10. Cupertino |
60,357 |
91.1 |
Top 10 Safest Large Cities In California (200,000+ people)
|
City |
Population |
Violent Crime Rate |
|
1. Irvine |
292,673 |
64.2 |
|
2. Glendale |
202,601 |
114.0 |
|
3. Santa Clarita |
218,103 |
127.0 |
|
4. Fremont |
240,887 |
166.1 |
|
5. Huntington Beach |
201,843 |
191.2 |
|
6. Anaheim |
353,915 |
316.5 |
|
7. Chula Vista |
275,230 |
328.5 |
|
8. Fontana |
215,883 |
342.3 |
|
9. Oxnard |
211,349 |
342.6 |
|
10. San Diego |
1,441,737 |
361.7 |
The 50 Safest Cities In California
|
City |
Population |
Violent Crime Rate |
|
1. Tiburon |
9,135 |
0.0 |
|
2. Monte Sereno |
3,507 |
0.0 |
|
3. Clayton |
12,356 |
8.1 |
|
4. Lafayette |
26,872 |
14.9 |
|
5. Palos Verdes Estates |
13,400 |
29.9 |
|
6. Los Altos Hills |
8,622 |
34.8 |
|
7. Coronado |
21,115 |
42.6 |
|
8. Hillsborough |
11,521 |
43.4 |
|
9. Laguna Woods |
16,043 |
43.6 |
|
10. Los Gatos |
30,793 |
45.5 |
|
11. Belvedere |
2,114 |
47.3 |
|
12. Danville |
44,997 |
51.1 |
|
13. Aliso Viejo |
52,247 |
51.7 |
|
14. Saratoga |
30,666 |
52.2 |
|
15. Hidden Hills |
1,903 |
52.5 |
|
16. Rolling Hills |
1,868 |
53.5 |
|
17. Benicia |
28,471 |
56.2 |
|
18. Buellton |
5,142 |
58.3 |
|
19. Yorba Linda |
68,225 |
61.6 |
|
20. Rancho Santa Margarita |
48,377 |
62.0 |
|
21. Irvine |
292,673 |
64.2 |
|
22. Laguna Niguel |
66,671 |
64.5 |
|
23. Hughson |
7,671 |
65.2 |
|
24. Lincoln |
48,625 |
65.8 |
|
25. Murrieta |
116,413 |
66.1 |
|
26. Mission Viejo |
95,453 |
68.1 |
|
27. Los Altos |
30,716 |
68.4 |
|
28. Villa Park |
5,840 |
68.5 |
|
29. Thousand Oaks |
127,811 |
68.9 |
|
30. Rancho Palos Verdes |
41,961 |
69.1 |
|
31. Moorpark |
36,826 |
70.6 |
|
32. La Canada Flintridge |
20,223 |
74.2 |
|
33. La Habra Heights |
5,357 |
74.7 |
|
34. San Ramon |
76,387 |
75.9 |
|
35. Lake Forest |
86,691 |
76.1 |
|
36. Seal Beach |
24,120 |
78.8 |
|
37. Ripon |
16,103 |
80.7 |
|
38. Ross |
2,470 |
81.0 |
|
39. Carpinteria |
13,514 |
81.4 |
|
40. Paradise |
26,879 |
81.8 |
|
41. Camarillo |
69,628 |
83.3 |
|
42. Orinda |
20,071 |
84.7 |
|
43. Pacific Grove |
15,605 |
89.7 |
|
44. Cupertino |
60,357 |
91.1 |
|
45. Bradbury |
1,089 |
91.8 |
|
46. Central Marin |
34,793 |
92.0 |
|
47. Kensington |
5,407 |
92.5 |
|
48. Fountain Valley |
55,858 |
94.9 |
|
49. Grover Beach |
13,574 |
95.8 |
|
50. Riverbank |
25,045 |
95.8 |
Related Posts:


")
Leave a Reply