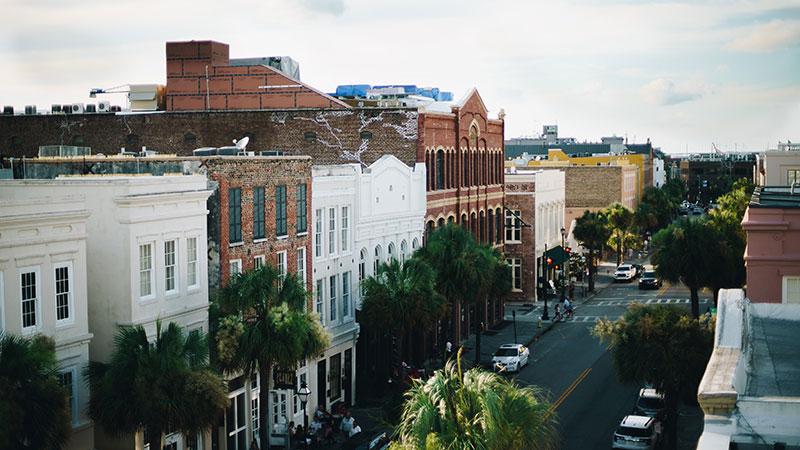
If you are thinking about visiting Charleston and have some qualms about the safety of the city, we got you covered.
We are going to deep dive into the statistics, look at some maps, graphs and talk to the residents of the city to give you a better understanding of how safe Charleston really is.
Is Charleston, South Carolina Safe To Visit?
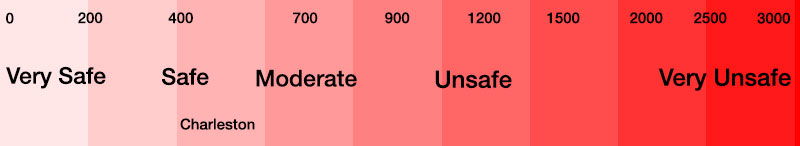
Statistically speaking, Charleston is a safe place to visit. In 2020, Charleston had a violent crime rate of 432.68 per 100,000 people. It’s violent crime rate is on par with the national average and with cities like Austin, El Paso and San Jose.
Here’s a scale to give you some perspective on Charleston’s violent crime rate.
Charleston, South Carolina Crime Stats
Here’s a breakdown of all the crimes in the city for 2020 compared to 2019:
|
|
2019 |
2020 |
Percent Change |
|
Homicide |
8 |
17 |
113% |
|
Rape |
51 |
54 |
6% |
|
Robbery |
95 |
100 |
5% |
|
Aggravated Assault |
362 |
479 |
32% |
|
Burglary |
293 |
326 |
11% |
|
Larceny/Theft |
2,338 |
2,439 |
4% |
|
Motor Vehicle Theft |
496 |
453 |
-9% |
|
Arson |
8 |
19 |
138% |
|
TOTALS |
3,651 |
3,887 |
6% |
**All data is from the FBI UCR**
Charleston’s Violent Crime Stats
In 2020 Charleston reported 650 violent crimes and had a violent crime rate of 432.68 per 100,000 people.
- The national average for violent crime is 398.5 per 100,000 residents. Charleston’s violent crime rate is 9% greater than the national average.
- Charleston’s violent crime rate is 18% less than the state average.
- Year over year violent crime has increased by 26%.
Here’s a map showing you how violent crime has trended in Charleston over a 30 year period.
- Charleston’s violent crime peaked in 1996 when there was 1,309 violent crimes reported and had a violent crime rate of 1,363.54 per 100,000 people.
- Violent crime has decreased by 50% from it’s peak in 1996.
- Violent crime was at its lowest level in 2013 and has been steadily rising since then.
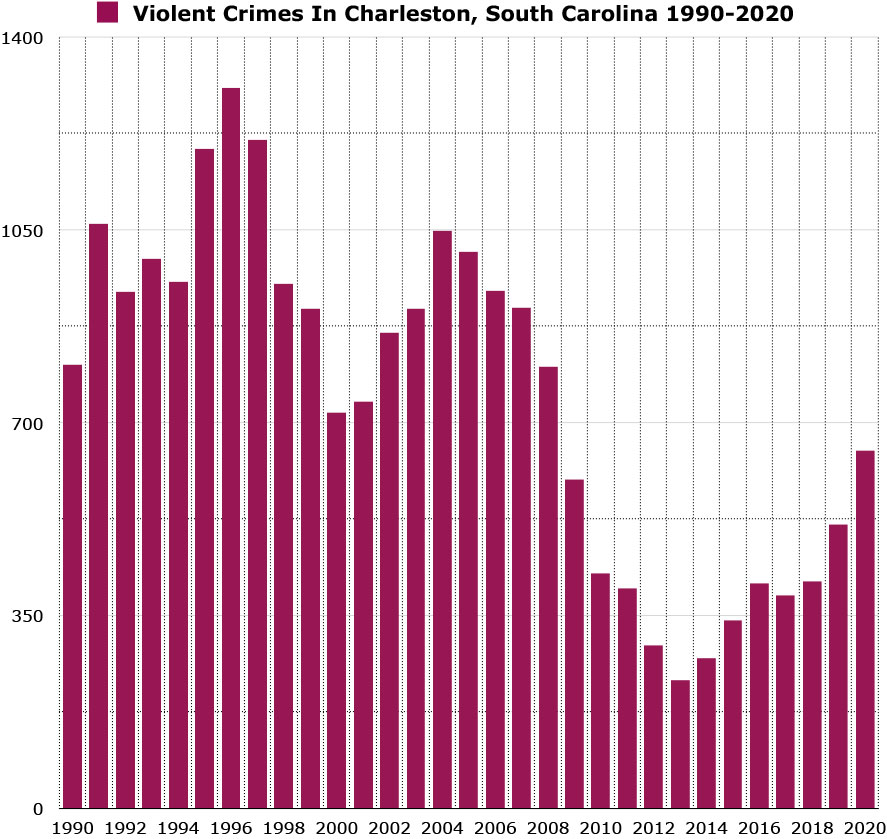
*Violent crimes include; homicides, rape, robbery and aggravated assaults and the violent crime rate is calculated by dividing the number of reported crimes by the total population; the result is multiplied by 100,000.
Charleston’s Property Crime Stats
In 2020 Charleston reported 3,218 property crimes and had a property crime rate of 2,142.09 per 100,000 people.
- The national average for property crime is 1958.2 per 100,000 residents. Charleston’s property crime rate is roughly 9% greater than the national average.
- Charleston’s property crime rate is roughly 21% less than the state average.
- Year over year property crime in Charleston has increased by 3%.
- Charleston has a similar property crime rate to Santa Ana, Scottsdale and Fremont.
Here’s a map showing you how property crime has trended in Charleston over a 30 year period.
- Property crime peaked in 1997 when there were 7,283 property crimes reported and the city had a property crime rate of roughly 7,586.46 per 100,000 people.
- Property crime has decreased 56% from it’s 30-year high in 1997.
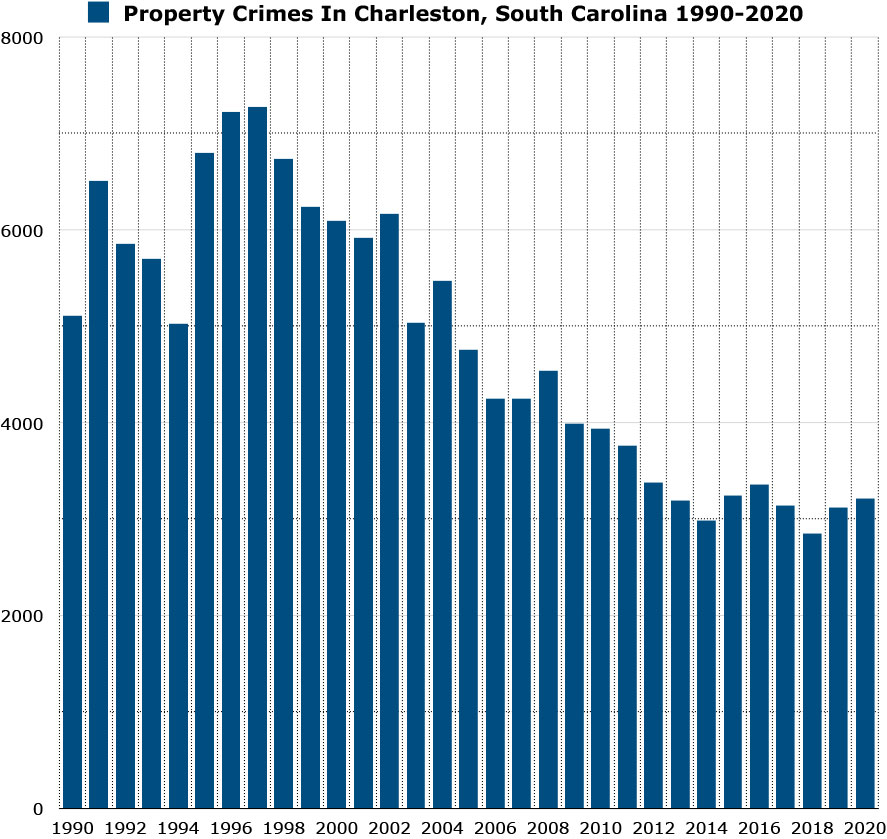
*Property crimes include; burglary, larceny-theft, motor vehicle theft, and arson and property crime rate is calculated by dividing the number of reported crimes by the total population; the result is multiplied by 100,000.
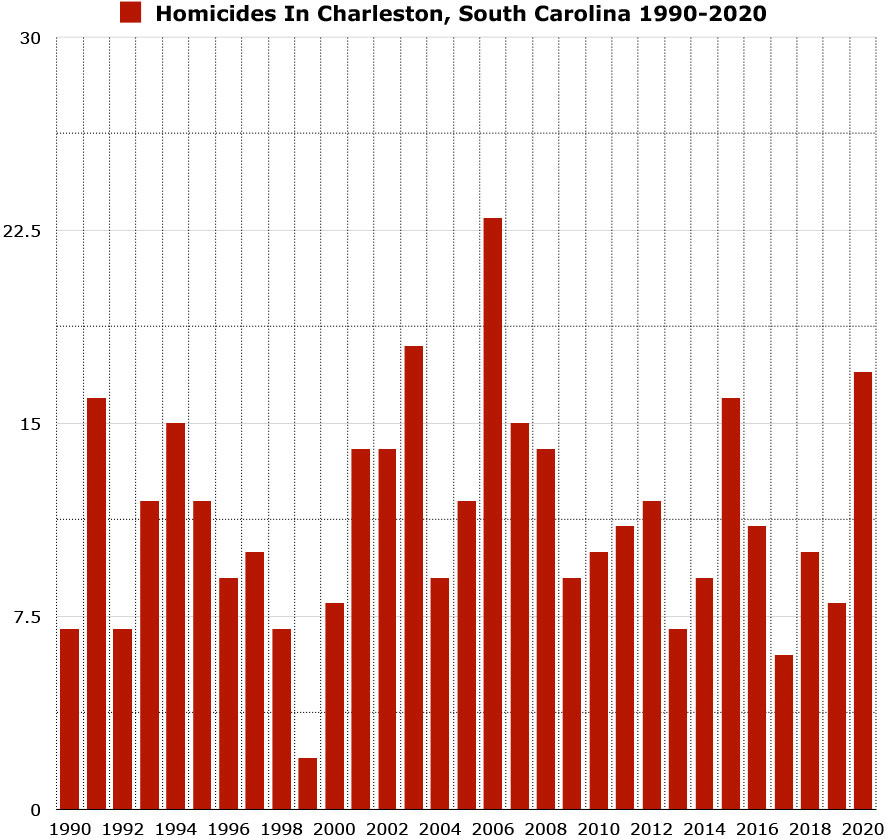
Charleston’s Murder Stats
In 2020, Charleston reported 17 homicides and had a homicide rate of 11.32 per 100,000 people.
- Year over year murder has increased by 113%.
- Charleston’s murder rate is 1.74x greater than the national average.
- Charleston’s murder rate is 8% greater than the state average.
- Charleston has a similar homicide rate to cities like Phoenix, Charlotte and Bakersfield.
Here’s a map showing you how homicides has trended in Charleston over a 30 year period.
- Homicides in Charleston peaked in 2006 when 23 homicides were reported and had a homicide rate of 20.12 per 100,000 people.
Charleston vs Other Cities In South Carolina
Here’s a graph showing you the violent crime rates of the 11 most populous cities in South Carolina. Charleston’s violent crime rate ranked 4th lowest among all cities.
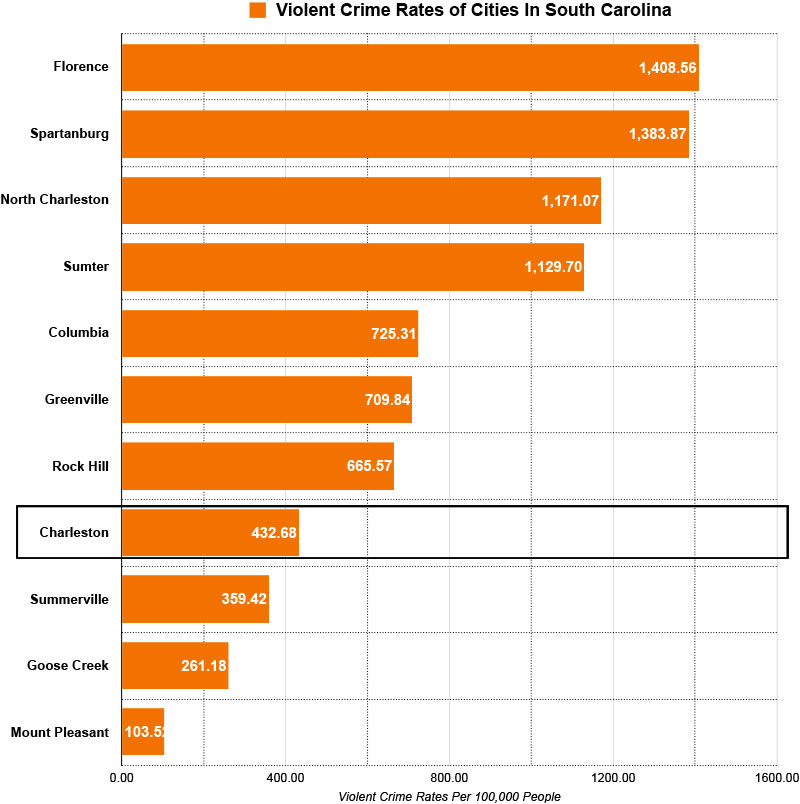
|
City |
Population |
Violent Crime Rate |
|
Florence |
39,899 |
1408.56 |
|
Spartanburg |
38,732 |
1383.87 |
|
North Charleston |
114,852 |
1171.07 |
|
Sumter |
43,463 |
1129.70 |
|
Columbia |
136,632 |
725.31 |
|
Greenville |
70,720 |
709.84 |
|
Rock Hill |
74,372 |
665.57 |
|
Charleston |
150,227 |
432.68 |
|
Summerville |
50,915 |
359.42 |
|
Goose Creek |
45,946 |
261.18 |
|
Mount Pleasant |
90,801 |
103.52 |
North Charleston vs Charleston
North Charleston is a separate city from Charleston, similarly to how Cleveland and East Cleveland are two distinct cities.
Not only are they completely different cities, they crime rates drastically differ. While Charleston’s crime rate is low, North Charleston suffers from some of the worst crime rates in the state.
In 2020 North Charleston had a violent crime rate of 1,171 per 100,000 people and is 2.7x greater than Charleston. North Charleston also had a homicide rate of 33.1, which is 3x greater than Charleston.
When it comes to crime Charleston and North Charleston couldn’t be anymore different. Charleston is way safer than North Charleston by a mile.
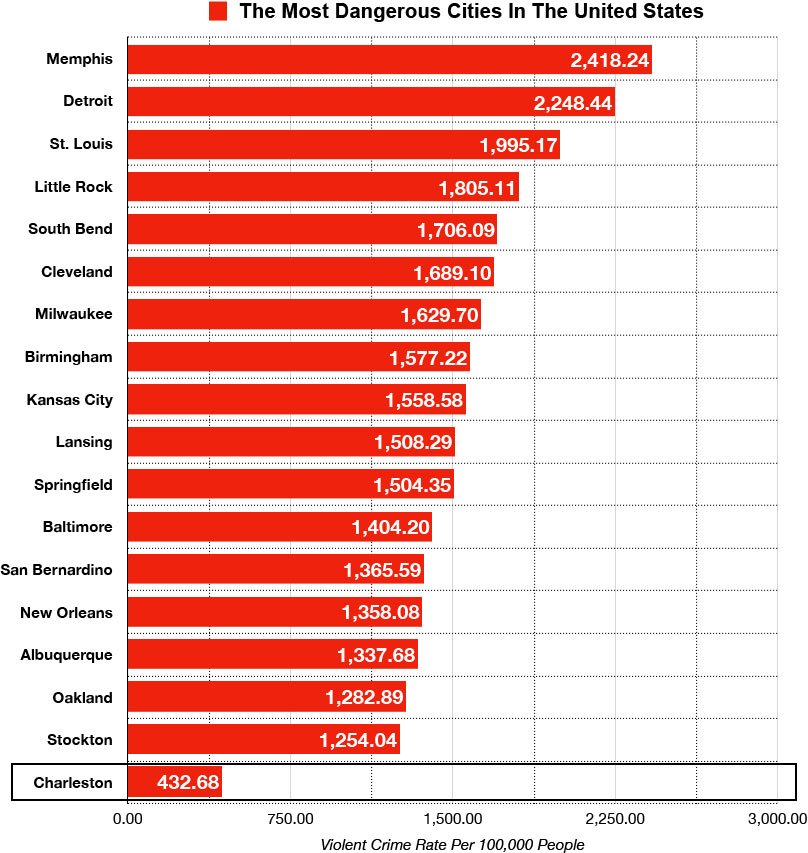
Charleston, South Carolina vs The Most Dangerous Cities in the United States
Here’s a list of the top 18 most dangerous cities in the United States ranked by violent crime rates. Charleston’s violent crime rate is 5.6x less than Memphis, the most dangerous city on the list.
|
City |
Number of violent crimes in 2020 |
Violent Crime Rate |
|
15,310 |
2,418.24 |
|
|
14,370 |
2,248.44 |
|
|
6,017 |
1,995.17 |
|
|
3,657 |
1,805.11 |
|
|
South Bend |
1,765 |
1,706.09 |
|
6,294 |
1,689.10 |
|
|
9,407 |
1,629.70 |
|
|
3,166 |
1,577.22 |
|
|
7,919 |
1,558.58 |
|
|
Lansing |
1,699 |
1,508.29 |
|
Springfield |
2,545 |
1,504.35 |
|
8,552 |
1,404.20 |
|
|
3,033 |
1,365.59 |
|
|
5,215 |
1,358.08 |
|
|
7,552 |
1,337.68 |
|
|
5,653 |
1,282.89 |
|
|
4,023 |
1,254.04 |
Neighborhoods In Charleston, South Carolina
Here’s a map that outlines the many neighborhoods in South Carolina.
Most Dangerous Neighborhoods In Charleston, South Carolina
- Eastside
- East Central
- Nassau St
- Ducs Ct
- America Street
- Ashley Hall road
Is Downtown Charleston, South Carolina Safe?
Downtown Charleston is generally a safe area to visit during the day time. At night the situation is a bit different and we recommend that you stay in the well populated areas and don’t stray off the beaten path.
America St. and the surrounding areas is the roughest parts of downtown and you should avoid those area at night.
Is Charleston, South Carolina safe from hurricanes?
Charleston is not safe from hurricanes and is susceptible to them, due to its location on the coast and is something you have to take into consideration when visiting
The last major hurricane to hit Charleston was Hurricane Hugo in 1989, which devastated the area with 140mph winds and left $7 billion in damage and caused 26 fatalities.
Charleston gets a direct hurricane hit every 9.93 years and gets a direct hit by a major hurricane every 49.67 years.
When is hurricane season in Charleston?
Hurricane season in Charleston officially runs from June 1 to Nov. 30. The peak of hurricane season is mid-August to mid-October.
Is it safe to visit Charleston during hurricane season?
It is safe to visit Charleston during hurricane season, as long as you don’t visit when a hurricane is about to hit! Fortunately there is usually adequate warning when a hurricane is brewing in the area.
Check out https://www.nhc.noaa.gov before you visit. This is your best resource for tracking and monitoring storms. Another great website to check out is https://spaghettimodels.com.
Is Charleston safe from Tornadoes?
Charleston is not safe from tornadoes and is slightly susceptible to them.
Tornadoes in South Carolina most often occur from March to May, according to the South Carolina Emergency Management Division
Is Charleston in tornado alley?
Charleston is not in tornado alley. The states of Texas, Louisiana, Arkansas, Oklahoma, Kansas, South Dakota, Iowa and Nebraska are consider part of tornado alley. A study of tornadoes that occurred between 1921–1995 concluded almost 1/4 of all significant tornadoes occur in this area.
Is the public transportation in Charleston safe?
The public transportation system in Charleston is handled by CARTA (Charleston Area Regional Transportation Authority) and it offers 16 fixed bus routes.
It is generally safe during commuting hours (8am – 6pm), however we do not recommend that you take the bus at night. You should opt for a taxi or ride sharing service instead.
What do residents of Charleston say about it’s safety?
- "I avoid anywhere to the east of I-26 and to the north of SC-17 on the peninsula. This is known as the “east side” of Charleston."
- "The city of North Charleston is sketchy. Going from Aviation down to city of Charleston it dangerous. Just don’t drive through the area at night."
- "Stay out of North Charleston, especially at night."
- "Charleston is generally safe. North Charleston is a different story."
- "Charleston is safe as long as stay out of the few ‘bad’ areas of downtown, eastside and North Charleston."
Is Charleston safe for women?
While there are no guarantees, Charleston is generally safe for female solo travelers as long as you learn the layout of the city, avoid problem areas, stay in well lit/well populated areas and avoid walking by yourself at night.
Is Charleston safe at night?
Charleston is safe at night as long as you stay away from the sketchy neighborhoods mentioned above. You should be able to mitigate your chances of being a victim if you study the layout of the city and avoid areas where crime is high.
Streets and squares that are perfectly safe in the day can be questionable at night. Stay where the tourists go during the day and avoid any places that are outside normal pedestrian areas at night.
Is Charleston’s tap water safe to drink?
The tap water in Charleston, South Carolina is safe to drink. While the tap water in Charleston meets the EPA health guidelines, it can still contain contaminants present in trace amounts that could potentially cause health issues over the long-run.
The biggest concern with tap water is immediately after a hurricane, which can disrupt the flow of clean water.
If you have any concerns about the tap water in Charleston, we suggest that you use bottle water for your drinking needs.
Tips to stay safe while visiting Charleston, South Carolina
- Check the weather forecast a few days before you arrive. Make sure you are not arriving when there is a major storm system is about to touch down on the city.
- Learn the layout of the city and learn which areas you should avoid.
- Always be aware of your surroundings. Don’t bury your face in your phone or get lost in your headphones.
- Stick to well-trafficked and brightly lit areas at night. Don’t walk through alleys or desolate areas.
A Few Things You Should Do While Visiting Charleston According To Locals
- Get a Carriage Ride in Downtown – The guides know literally everything about the history of Charleston.
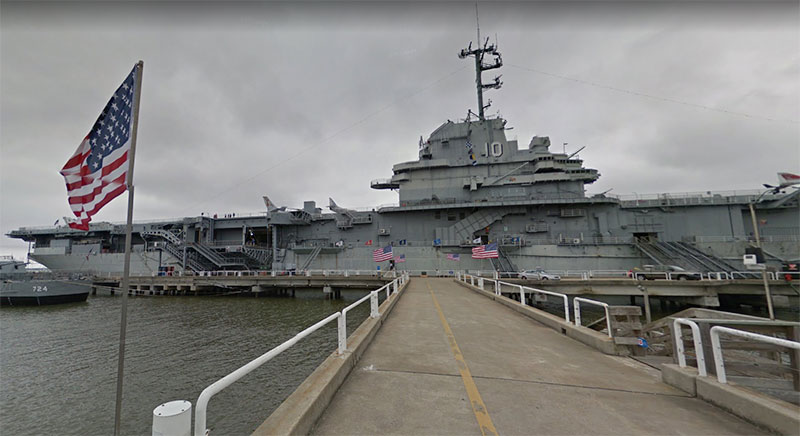
- USS Yorktown – Awesome experience to see and board an aircraft carrier that help defeat the Axis in WW2.
- Magnolia Plantation and Gardens – Great historical place to visit.
- Husk – If you have money to spend, spend it here.
- Walk along the Rainbow Row and Battery to see beautifully restored historic houses
Quick Facts About Charleston
|
|
Charleston, South Carolina |
United States |
|
Population, Census, April 1, 2020 |
150,227 |
331,449,281 |
|
Population, Census, April 1, 2010 |
120,083 |
308,745,538 |
|
Black or African American alone, percent |
21.7% |
13.4% |
|
American Indian and Alaska Native alone, percent |
0.1% |
1.3% |
|
Asian alone, percent |
1.9% |
5.9% |
|
Native Hawaiian and Other Pacific Islander alone, percent |
0.1% |
0.2% |
|
Two or More Races, percent |
1.5% |
2.8% |
|
Hispanic or Latino, percent |
3.2% |
18.5% |
|
White alone, not Hispanic or Latino, percent |
71.5% |
60.1% |
|
Foreign born persons, percent, 2015-2019 |
4.8% |
13.6% |
|
Median value of owner-occupied housing units, 2015-2019 |
$330,600.00 |
$217,500.00 |
|
Median selected monthly owner costs -with a mortgage, 2015-2019 |
$1,807.00 |
$1,595.00 |
|
Median gross rent, 2015-2019 |
$1,257.00 |
$1,062.00 |
|
High school graduate or higher, percent of persons age 25 years+, 2015-2019 |
94.9% |
88.0% |
|
Bachelor’s degree or higher, percent of persons age 25 years+, 2015-2019 |
53.1% |
32.1% |
|
In civilian labor force, total, percent of population age 16 years+, 2015-2019 |
66.9% |
63.0% |
|
Median household income (in 2019 dollars), 2015-2019 |
$68,438.00 |
$62,843.00 |
|
Per capita income in past 12 months (in 2019 dollars), 2015-2019 |
$42,872.00 |
$34,103.00 |
|
Persons in poverty, percent |
13.2% |
11.4% |
")
")

Leave a Reply