If you are thinking about visiting Richmond and have some qualms about the safety of the city, we got you covered.
We are going to deep dive into the statistics, look at some maps, graphs and talk to the residents of the city to give you a better understanding of how safe Richmond really is.
Is Richmond, Virginia Safe To Visit?
Statistically speaking, Richmond is a safe place to visit. In 2020, Richmond had a violent crime rate of 359.21 per 100,000 people. It’s violent crime rate is 10% less than the national average and is on par with cities like El Paso, San Jose and Anaheim.
Richmond, Virginia Crime Stats
Here’s a breakdown of all the crimes in the city for 2020 compared to 2019:
In 2020 Richmond reported 814 violent crimes and had a violent crime rate of 359.21 per 100,000 people.
The national average for violent crime is 398.5 per 100,000 residents. Richmond’s violent crime rate is 10% less than the national average.
Richmond’s violent crime rate is 1.7x greater than the state average.
Year over year violent crime has decreased by 24%.
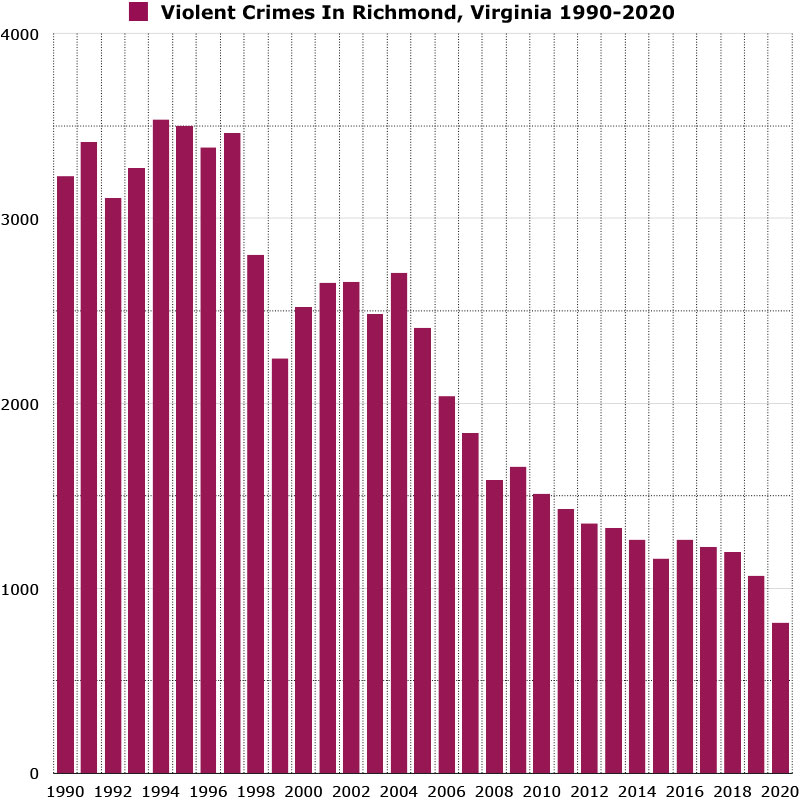
Here’s a map showing you how violent crimes have trended in Richmond over a 30 year period.
Violent crime peaked in 1994 when Richmond reported 3,534 violent crimes and had a violent crime rate of 1,767.00 per 100,000 people
Violent crime has decreased 77% from its peak from 1994.
*Violent crimes include; homicides, rape, robbery and aggravated assaults and the violent crime rate is calculated by dividing the number of reported crimes by the total population; the result is multiplied by 100,000.
Richmond’s Property Crime Stats
In 2020 Richmond reported 6,816 property crimes and had a property crime rate of 3,007.81 per 100,000 people.
The national average for property crime is 1958.2 per 100,000 residents. Richmond’s property crime rate is roughly 1.5x greater than the national average.
Richmond’s property crime rate is roughly 2x greater than the state average.
Year over year property crime in Richmond has decreased by 19%.
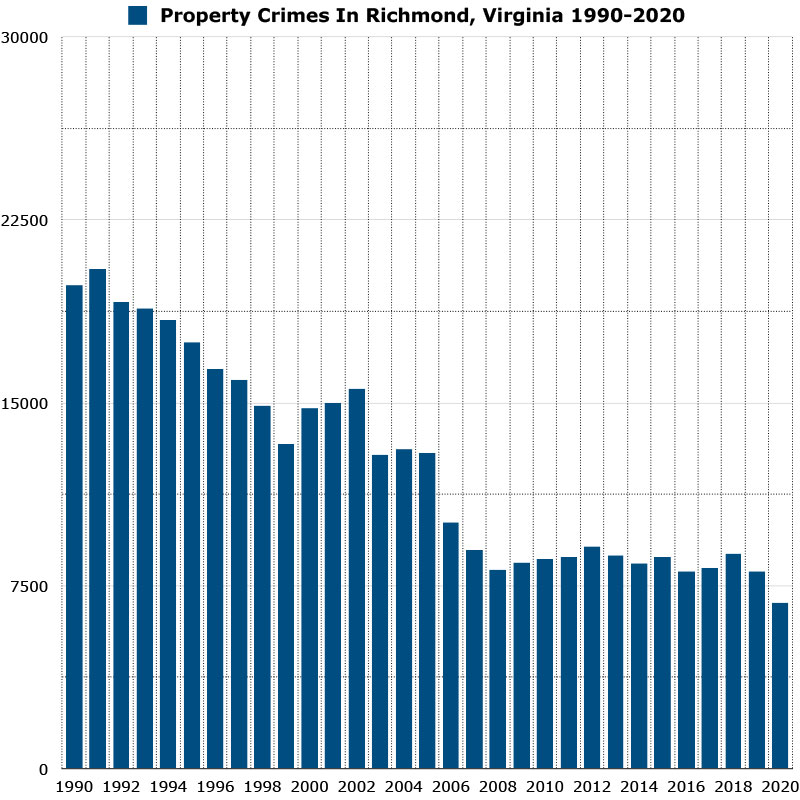
Here’s a map showing you how property crimes have trended in Richmond over a 30 year period.
Property crime peaked in 1993 when Richmond reported 20,503 violent crimes and had a property crime rate of 10,251.50 per 100,000 people
Property crime has decreased 67% from its peak from 1991.
*Property crimes include; burglary, larceny-theft, motor vehicle theft, and arson and property crime rate is calculated by dividing the number of reported crimes by the total population; the result is multiplied by 100,000.
Richmond’s Murder Stats
In 2020, Richmond reported 66 homicides and had a homicide rate of 29.12 per 100,000 people.
Richmond’s murder rate is 4.5x greater than the national average.
Richmond’s murder rate is 4.8x greater than the state average.
In 2021, Richmond reported 93 homicides, which is a 41% increase from 2020.
Richmond has an abnormally high homicide rate compared to its low violent crime rate.
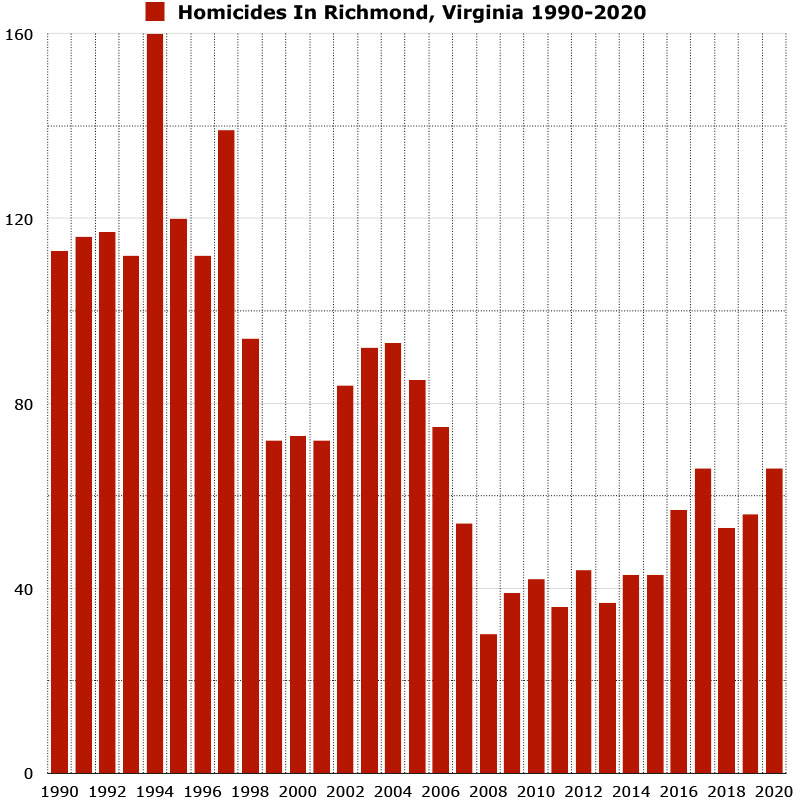
Here’s a map showing you how homicides have trended in Richmond over a 30 year period.
Homicides peaked in 1994 when there was 160 homicides reported and had a murder rate of 80 per 100,000 people.
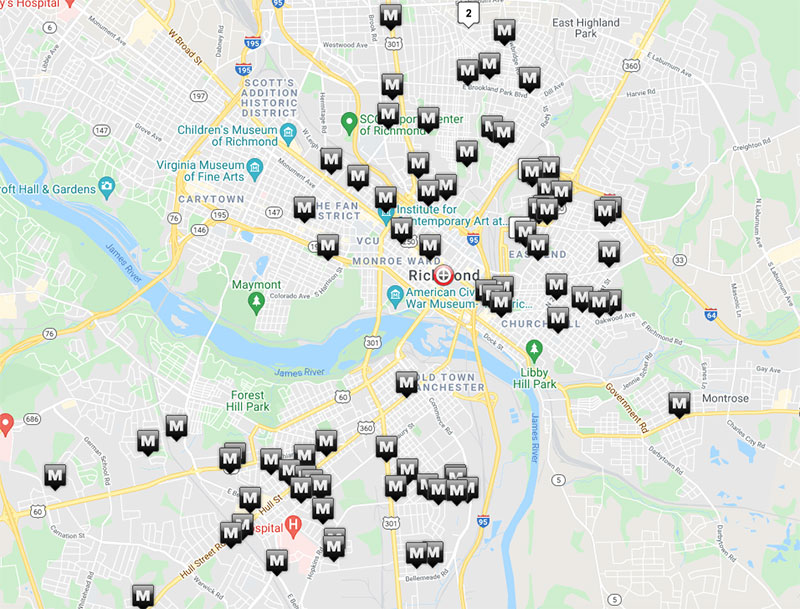
Here’s a maps showing you the locations of all the homicides in 2021
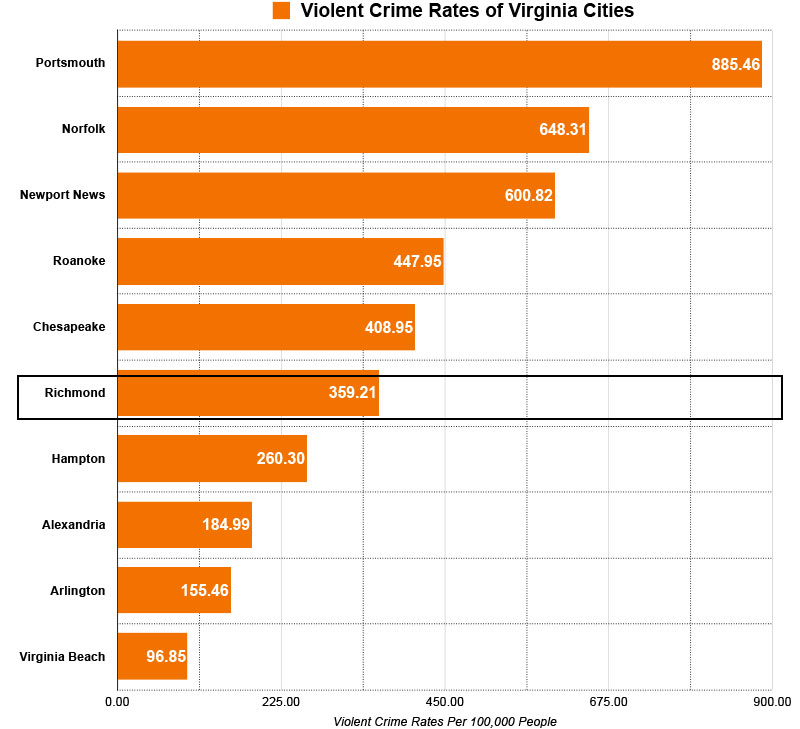
Richmond vs Other Cities In Virginia
Here’s a graph showing you the violent crime rates of the 10 most populous cities in Virginia. Richmond’s violent crime rate ranked 6th highest among all cities.
City
Population
Violent Crime Rate
Portsmouth
97,915
885.46
Norfolk
238,005
648.31
Newport News
186,247
600.82
Roanoke
100,011
447.95
Chesapeake
249,422
408.95
Richmond
226,610
359.21
Hampton
137,148
260.30
Alexandria
159,467
184.99
Arlington
238,643
155.46
Virginia Beach
459,470
96.85
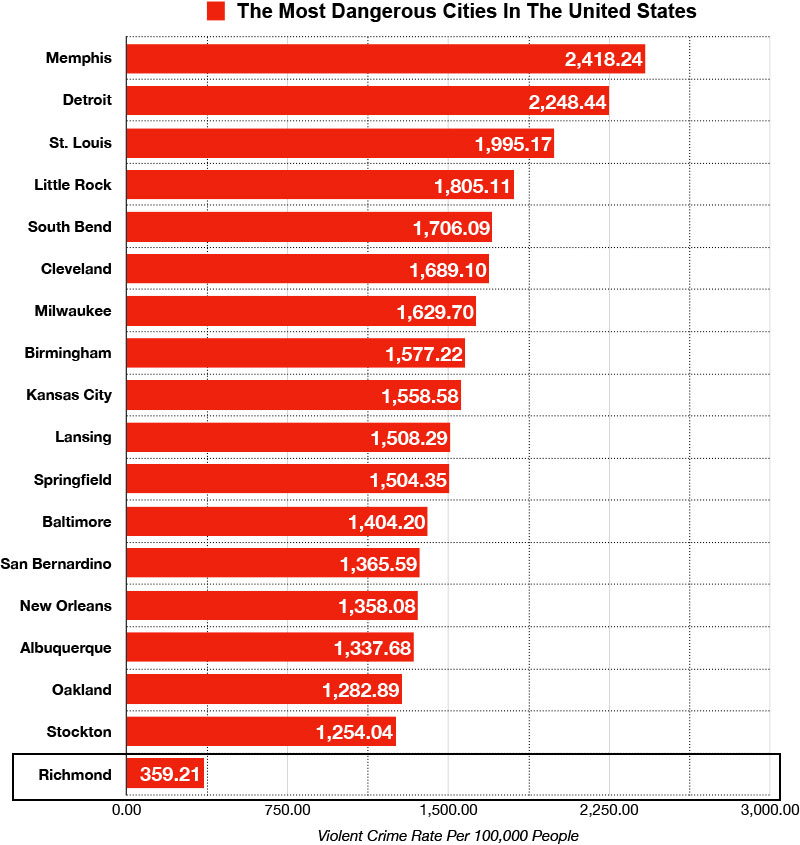
Richmond, Virginia vs The Most Dangerous Cities in the United States
Here’s a list of the top 18 most dangerous cities in the United States ranked by violent crime rates. Richmond’s violent crime rate is 6.7x less than Memphis, the most dangerous city on the list.
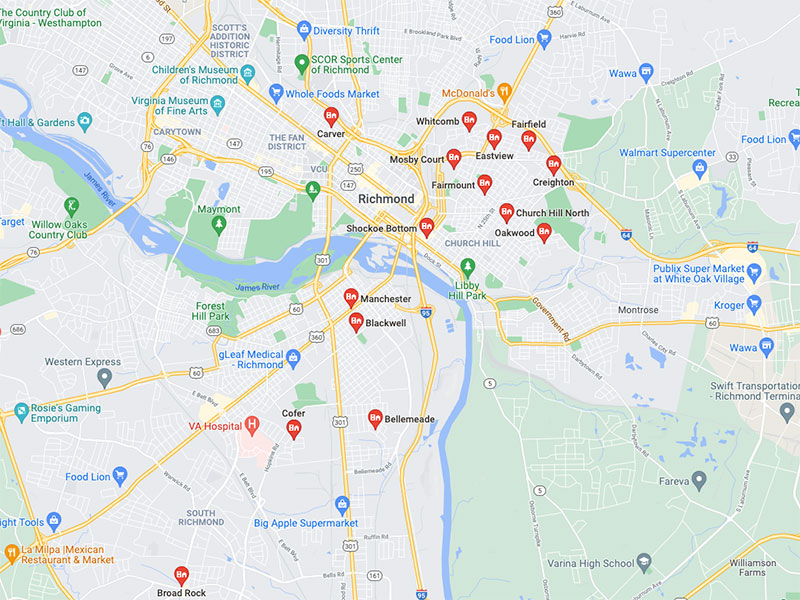
Most Dangerous Neighborhoods In Richmond, Virginia
South Of The James River
Cofer
Highland Springs
Carver
Church Hill North
Whitcomb
Creighton
Fairfield
Eastview
Mosby
Fairmount
Oakwood
Shockoe Bottom
Blackwell
Bellemeade
Manchester
Clopton
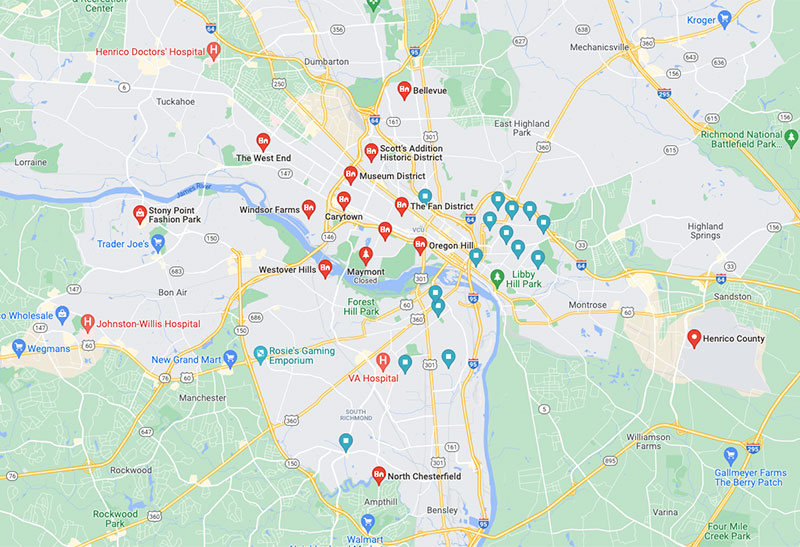
Safest Neighborhoods in Richmond, Virginia
Windsor Farms
West End
The Fan District
Oregon Hill
Randolph
Maymont
Carytown
Museum District
Scotts Addition
Bellevue
Westover Hills
North Chesterfield
Stony Point
Short Pump
Glen Allen
Henrico
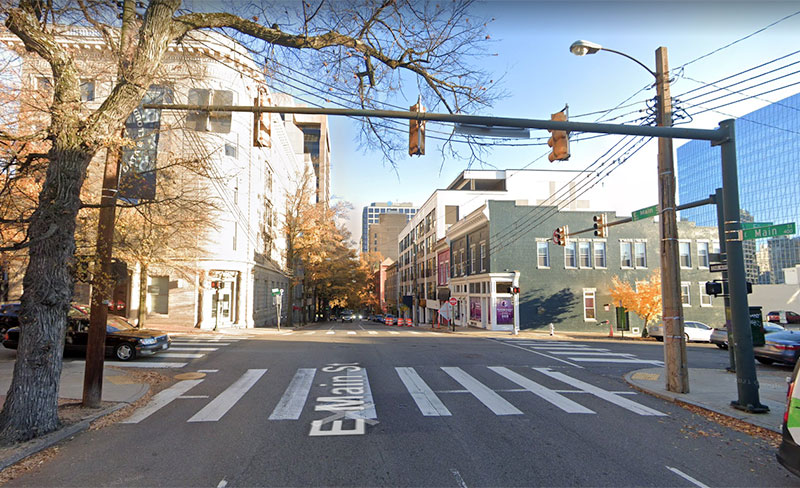
Is Downtown Richmond, Virginia Safe?
Downtown Richmond is generally a safe area to visit during the day time. At night, we recommend that you don’t venture out of the immediate downtown area, stay in well populated places and don’t stray off the beaten path.
Many residents say that downtown is kind of a deadzone after 6pm and certain areas can feel very ’empty’. Residents also mention that the area around 5th to 13th is fine, but from 13th to 21st should be avoided at night and you should avoid going too far east into Shockoe Bottom, which is a sketchy part of town.
Is Richmond, Virginia safe from hurricanes?
Richmond is not safe from hurricanes and is susceptible to them. In 2003 Richmond was battered by 73mph wind gusts from Hurricane Isabel. The hurricane blew down thousands of trees across the area, knocking out power to over 2 million households, killed 36 people and left in its wake $1.85 billion in damages.
Hurricane season in Richmond is from June 1st through November 30th and the peak of hurricane season is mid-August to mid-October. Although hurricanes can and have occurred outside this time frame.
Is it safe to visit Richmond during hurricane season?
It is safe to visit Richmond during hurricane season, as long as you don’t visit when a hurricane is about to hit! Fortunately there is usually adequate warning when a hurricane is brewing in the area.
Richmond is not safe from tornadoes and is susceptible to them. Tornadoes in Virginia most often occur from March to May. Richmond is in the path of a tornado alley called ‘Dixie Alley‘.
Dixie Alley stretches from eastern Texas and Arkansas across Virginia, Mississippi, Tennessee, Virginia, Georgia, and far western Kentucky to upstate South Carolina and western North Carolina.
Between 1991-2010, Virginia on average experienced 18 tornadoes annually. Virginia suffers the most tornados between the months of April and September.
Richmond last saw tornadoes on Sept. 17, 2018 when 5 separate tornadoes tracked within the city limits. Most of the damage consisted of snapped trees and power poles.
Is the public transportation in Richmond safe?
The public transportation system in Richmond is handled by GRTC (Greater Richmond Transit Company). and it offers 40 fixed bus routes.
It is generally safe to use the public transportation of Richmond during commuting hours (8am – 6pm), however we do not recommend that you take the bus at night. You should opt for a taxi or ride sharing service instead.
What do residents of Richmond say about it’s safety?
" Richmond has seen a massive transformation over the past ten years. Places that used to be no-go zones are desirable places to live now."
"The West End is where more affluent people live, so their crime rates are much lower."
" In general, the higher-crime neighborhoods are on the eastern and southern sides of Richmond."
"Most of the city is genearlly safe. A few pockets near the housing projects (mostly called something ‘Court’) are bad."
"Avoid South Richmond (south of the river and east of route 150)."
"The dangerous areas of Richmond are nowhere near as bad as cities like Newark or Baltimore."
"Richmond is not at all bad. Most crime is concentrated in certain areas and these are areas you don’t want to visit anyways."
"Avoid any neighborhood whose name ends in “Court”"
Is Richmond safe for women?
While there are no guarantees, Richmond is generally safe for female solo travelers as long as you learn the layout of the city, avoid problem areas, stay in well lit/well populated areas and avoid walking by yourself at night.
Is Richmond safe at night?
Richmond is safe at night as long as you stay away from the sketchy neighborhoods mentioned above. You should be able to mitigate your chances of being a victim if you study the layout of the city and avoid areas where crime is high.
Streets and squares that are perfectly safe in the day can be questionable at night. Stay where the tourists go during the day and avoid any places that are outside normal pedestrian areas at night.
Is Richmond’s tap water safe to drink?
The tap water in Richmond, Virginia is safe to drink. From Oct. 31, 2018 to Dec. 31, 2021, Richmond only had 1 non-health-based violation.
While the tap water in Richmond meets the EPA health guidelines, it can still contain contaminants present in trace amounts that could potentially cause health issues over the long-run.
The biggest concern with tap water is immediately after a hurricane or tornado, which can disrupt the flow of clean water.
If you have any concerns about the tap water in Richmond, we suggest that you use bottle water for your drinking needs.
Tips to stay safe while visiting Richmond, Virginia
Check the weather forecast before you arrive. Make sure you are not arriving when there is a major storm system is about to touch down on the city.
Learn the layout of the city and figure out which areas you should avoid. Book your accommodations accordingly.
Save the sight seeing for the daytime. At night the situation can drastically change in certain neighborhoods.
A Few Things You Should Do While Visiting Richmond According To Locals
Maymont – 100-acre historic estate and park. Beautiful area to walk and spend the day
")
")
")
")
")
")
")
")
")
Leave a Reply