If you are thinking about visiting Myrtle Beach and have some qualms about the safety of the city, we got you covered.
We are going to deep dive into the statistics, look at some maps, graphs and talk to the residents of the city to give you a better understanding of how safe Myrtle Beach really is.
Is Myrtle Beach, South Carolina Safe To Visit?
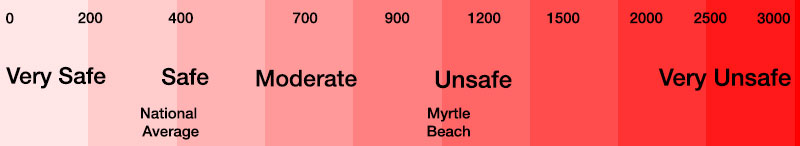
Statistically speaking, Myrtle Beach is an unsafe place to visit. In 2020, Myrtle Beach had a violent crime rate of 1,165.85 per 100,000 people. It’s violent crime rate is 2.9x greater than the national average and its property crime rate is 4.5x greater than the national average.
Keep in mind that the crime stats can be skewed, because while Myrtle Beach has a population of only 35,682 people, more than 18M tourists visit yearly and the crimes of the 18m tourist are also included in the per capita calculations.
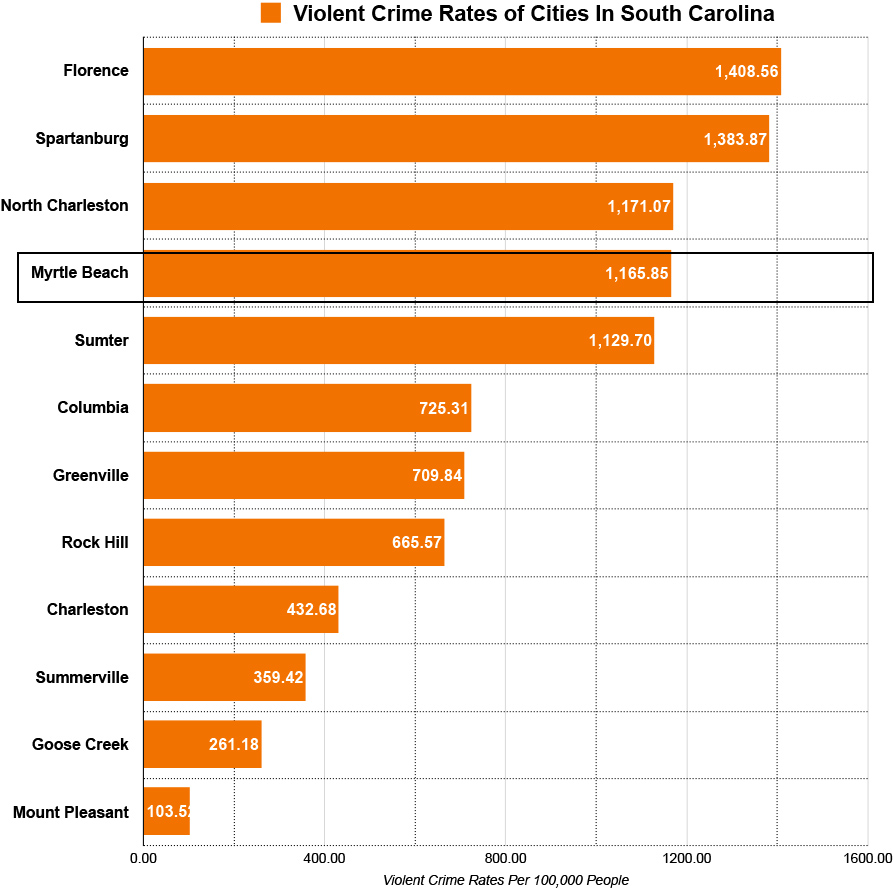
Here’s a scale to give you some perspective on Myrtle Beach’s violent crime rate:
Myrtle Beach, South Carolina Crime Stats
Here’s a breakdown of all the crimes in the city for 2020 compared to 2019:
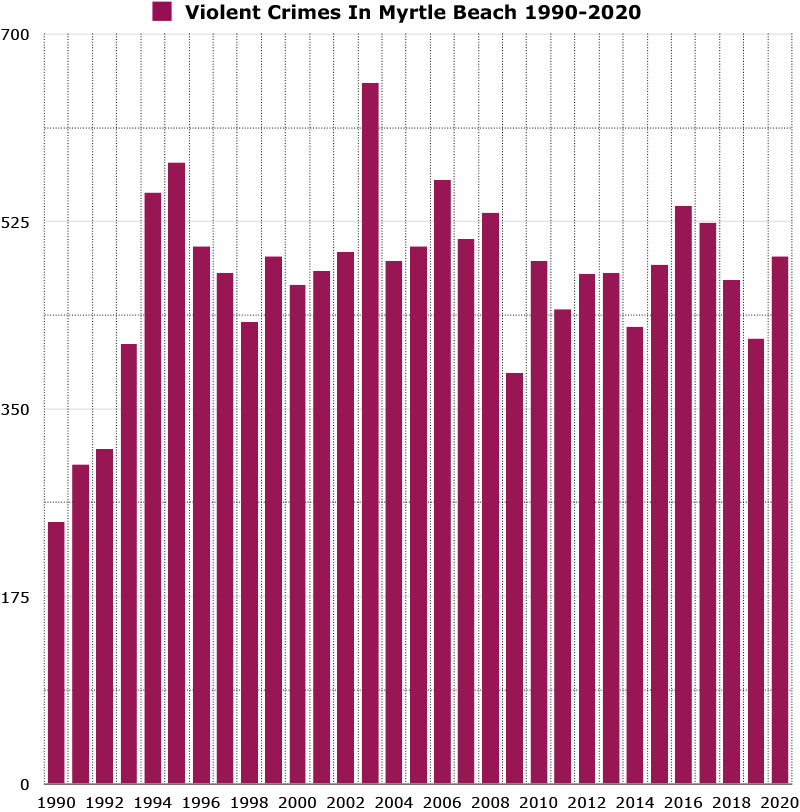
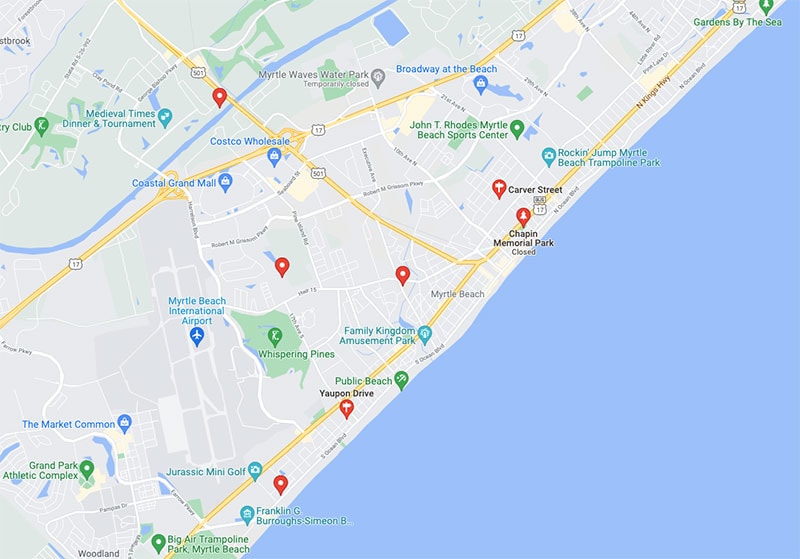
Here’s a map showing you how violent crime has trended in Myrtle Beach over a 30 year period.
Myrtle Beach’s violent crime peaked in 2003 when there was 654 violent crimes reported and had a violent crime rate of 2,583.04 per 100,000 people.
Violent crime has decreased by 36% from it’s peak in 2003.
Violent crime was at its lowest level in 1990.
*Violent crimes include; homicides, rape, robbery and aggravated assaults and the violent crime rate is calculated by dividing the number of reported crimes by the total population; the result is multiplied by 100,000.
Myrtle Beach’s Property Crime Stats
In 2020 Myrtle Beach reported 3,108 property crimes and had a property crime rate of 8,710.27 per 100,000 people.
The national average for property crime is 1958.2 per 100,000 residents. Myrtle Beach’s property crime rate is roughly 4.5x greater than the national average.
Myrtle Beach’s property crime rate is roughly 3.2x greater than the state average.
Year over year property crime in Myrtle Beach has decreased by 26%.
Myrtle Beach has one of the highest property crime rates in the nation. It’s property crime rate is similar to Albuquerque, Memphis and San Francisco.
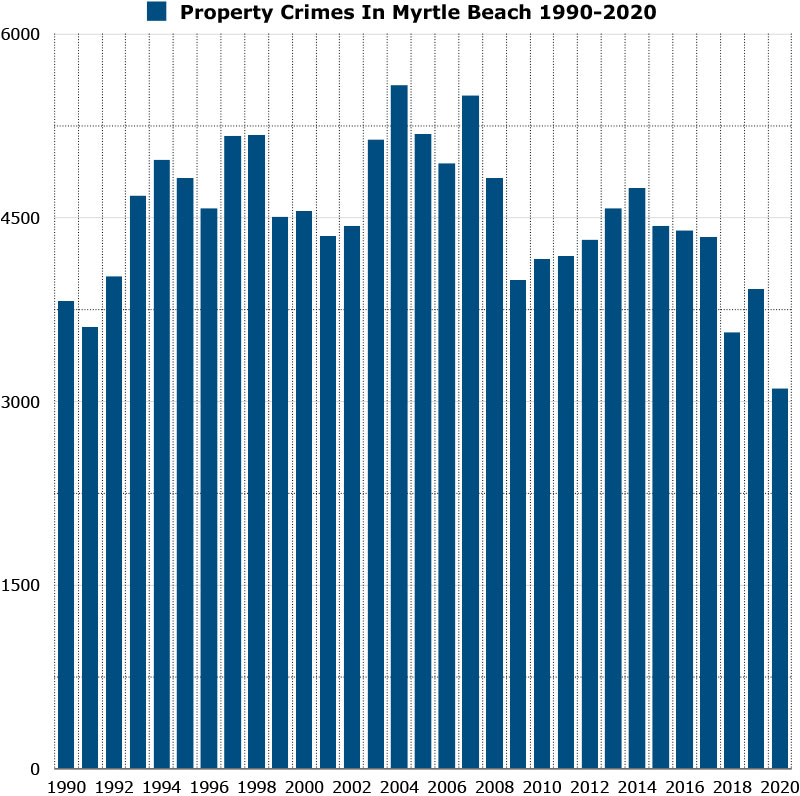
Here’s a map showing you how property crime has trended in Myrtle Beach over a 30 year period.
Property crime peaked in 2004 when there were 5,580 property crimes reported and the city had a property crime rate of roughly 22,038.79 per 100,000 people.
Property crime has decreased 44% from it’s 30-year high in 2004.
*Property crimes include; burglary, larceny-theft, motor vehicle theft, and arson and property crime rate is calculated by dividing the number of reported crimes by the total population; the result is multiplied by 100,000.
Myrtle Beach’s Murder Stats
In 2020, Myrtle Beach reported 6 homicides and had a homicide rate of 16.82 per 100,000 people.
Year over year murder has increased by 100%.
Myrtle Beach’s murder rate is 2.6x greater than the national average.
Myrtle Beach’s murder rate is 1.6x greater than the state average.
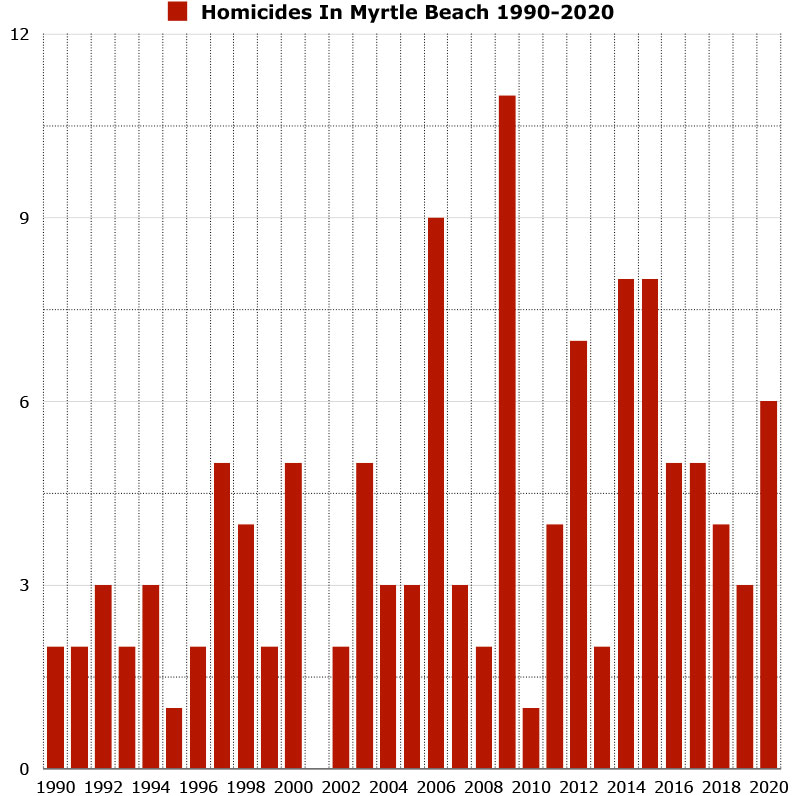
Here’s a map showing you how homicides has trended in Myrtle Beach over a 30 year period.
Homicides in Myrtle Beach peaked in 2006 when 23 homicides were reported and had a homicide rate of 20.12 per 100,000 people.
Myrtle Beach vs Other Cities In South Carolina
Here’s a graph showing you the violent crime rates of the 13 most populous cities in South Carolina. Myrtle Beach’s violent crime rate ranked 4th highest among all cities.
North Myrtle Beach is a separate city from Myrtle Beach, similarly to how Cleveland and East Cleveland are two distinct cities. While Myrtle Beach has the reputation of being a party town, North Myrtle Beach is a lot more tame and a lot less crowded.
When it comes to crime, North Myrtle beach has a significantly lower rate of crime.
In 2020 North Myrtle Beach had a violent crime rate of 526.87 per 100,000 people and is 2.2x less than Myrtle Beach. North Myrtle Beach also had a property crime rate of 5,306.01 per 100,000 people, which is 1.6x less than Myrtle Beach.
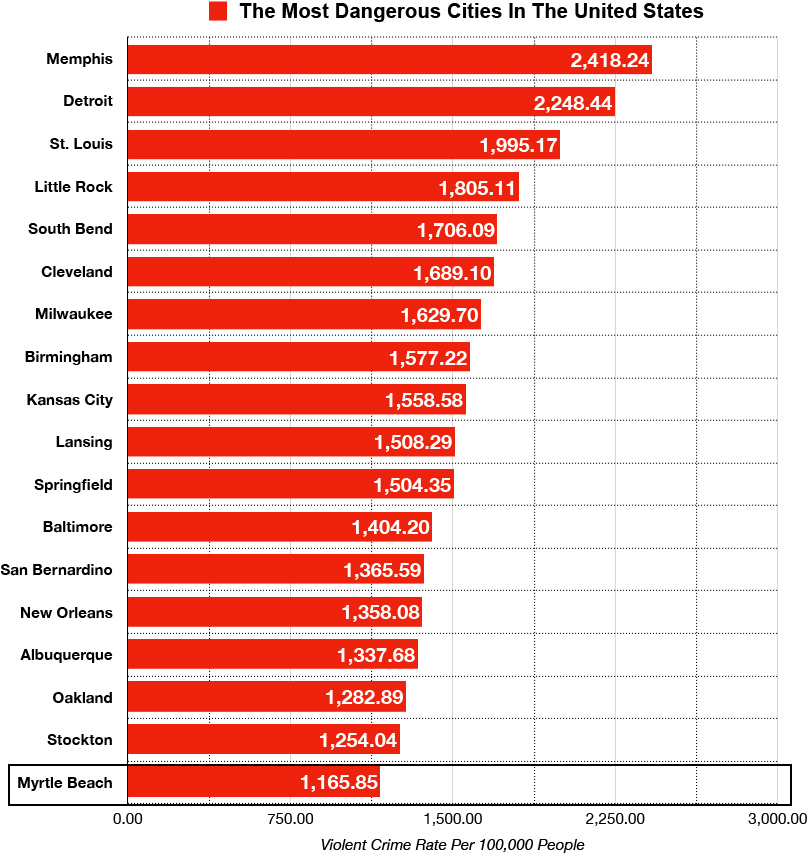
Myrtle Beach, South Carolina vs The Most Dangerous Cities in the United States
Here’s a list of the top 18 most dangerous cities in the United States ranked by violent crime rates. Myrtle Beach’s violent crime rate is 5.6x less than Memphis, the most dangerous city on the list.
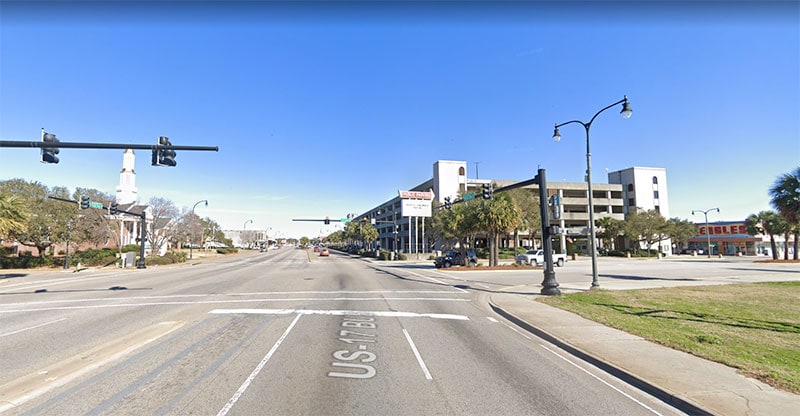
Downtown Myrtle Beach is generally a safe area to visit during the day time. At night the situation is a bit different as there is not a lot going on, there is not many people around and is desolate. Many residents advise not wandering around the area at night and stay in more well populated areas.
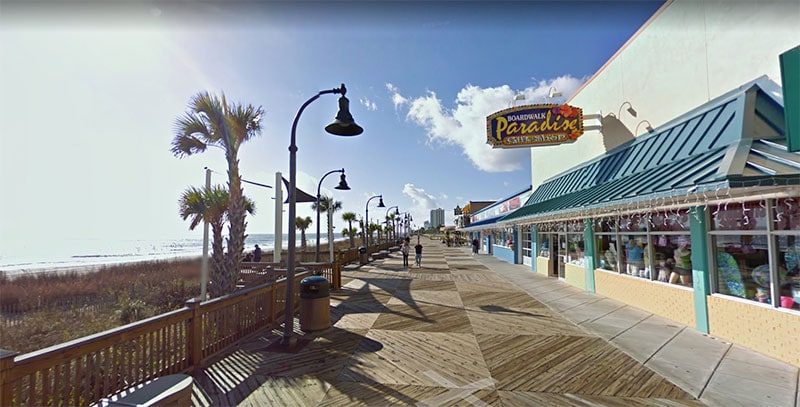
Is the Myrtle Beach Boardwalk Safe?
The Myrtle Beach Boardwalk is generally a safe area. There is a large police presence and there are plenty of people around.
At night there is less people around, especially on the weekdays, but the area is very well lit and vagrants don’t take over the boardwalk like its west coast counterpart, Venice Beach.
Is Myrtle Beach, South Carolina safe from hurricanes?
Myrtle Beach is very susceptible to hurricanes and is actually one of the most affected cities due to its location on the coast and is something you have to take into consideration when visiting
Myrtle Beach has been directly affected by a hurricanes or tropical storms every 1.94 years.
The last major storm to hit Myrtle Beach was tropical storm Elsa in 2021.
Hurricane season in Myrtle Beach officially runs from June 1 to Nov. 30. The peak of hurricane season is mid-August to mid-October.
Is it safe to visit Myrtle Beach during hurricane season?
It is safe to visit Myrtle Beach during hurricane season, as long as you don’t visit when a hurricane is about to hit! Fortunately there is usually adequate warning when a hurricane is brewing in the area.
Myrtle Beach is not completely safe from tornadoes and is susceptible to them.
In 2001, two F2 strength tornadoes touch down on the city with winds as high as 150 mph. The tornadoes injured 39 people and caused $8.8 million in damage.
Is the public transportation in Myrtle Beach safe?
The public transportation system in Myrtle Beach is handled by Coast RTA (Waccamaw Regional Transportation Authority) and it offers 3 fixed bus routes that interweave throughout the city.
It is generally safe during commuting hours (8am – 6pm), however we do not recommend that you take the bus at night. You should opt for a taxi or ride sharing service instead.
What do residents of Myrtle Beach say about it’s safety?
"Tourists heavily skew our crime stats. It’s nowhwere near as dangerous as Chicago or Detroit."
"I’ve lived here for a decade and vacationed here while growing up and have never felt unsafe. Sure, there are bad places in the city, but they need to be sought out. You don’t just stumble upon a bad neighborhood in Myrtle Beach.
"Downtown is arguably the sketchiest part of Myrtle Beach."
"Don’t stay near the board walk, but do visit. Broadway at night is where the night life is and it can get loud and rowdy."
"Stay away from the Atlantic Beach area. It’s desolate and sketchy even on Ocean Blvd."
Is Myrtle Beach safe for women?
While there are no guarantees, Myrtle Beach is generally safe for female solo travelers as long as you learn the layout of the city, avoid problem areas, stay in well lit/well populated areas and avoid walking by yourself at night.
Is Myrtle Beach safe at night?
Myrtle Beach is safe at night as long as you stay away from the sketchy neighborhoods mentioned above. You should be able to mitigate your chances of being a victim if you study the layout of the city and avoid areas where crime is high.
Streets and squares that are perfectly safe in the day can be questionable at night. Stay where the tourists go during the day and avoid any places that are outside normal pedestrian areas at night.
Is Myrtle Beach’s tap water safe to drink?
The tap water in Myrtle Beach, South Carolina is safe to drink. From Oct. 31, 2018 to Dec. 31, 2021, Myrtle Beach only had 0 health violations.
While the tap water in Myrtle Beach meets the EPA health guidelines, it can still contain contaminants present in trace amounts that could potentially cause health issues over the long-run.
The biggest concern with tap water is immediately after a hurricane, which can disrupt the flow of clean water.
If you have any concerns about the tap water in Myrtle Beach, we suggest that you use bottle water for your drinking needs.
Tips to stay safe while visiting Myrtle Beach, South Carolina
Check the weather forecast a few days before you arrive. Make sure you are not arriving in the midst of a major storm system.
Do you research before you visit. Figure out which parts of the city you should avoid and book your accomodations accordinglhy.
Myrtle Beach has a huge property crime issue. Always keep an eye on and secure your belongings.
Park in a well lit area, use the Parkmobile app for less expensive parking and so you don’t feed a meter every two hours.
Don’t walk by yourself at night, especially in desolate areas.
Things To Do In Myrtle Beach According To Locals
Brookgreen Gardens – Absolutely beautiful place to spend the day. Must visit!
Myrtle Beach State Park – Features a fishing pier, swimming along the beach, bird watching, and trails for walking and biking
")
")

")
")
")
")
")
")
Leave a Reply