If you are thinking about visiting Tampa and have some qualms about the safety of the city, we got you covered.
We are going to deep dive into the statistics, look at some maps, graphs and talk to the residents of the city to give you a better understanding of how safe Tampa really is.
Is Tampa, Florida Safe To Visit?
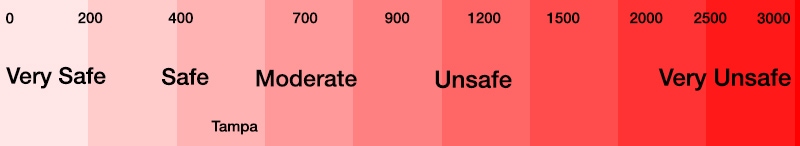
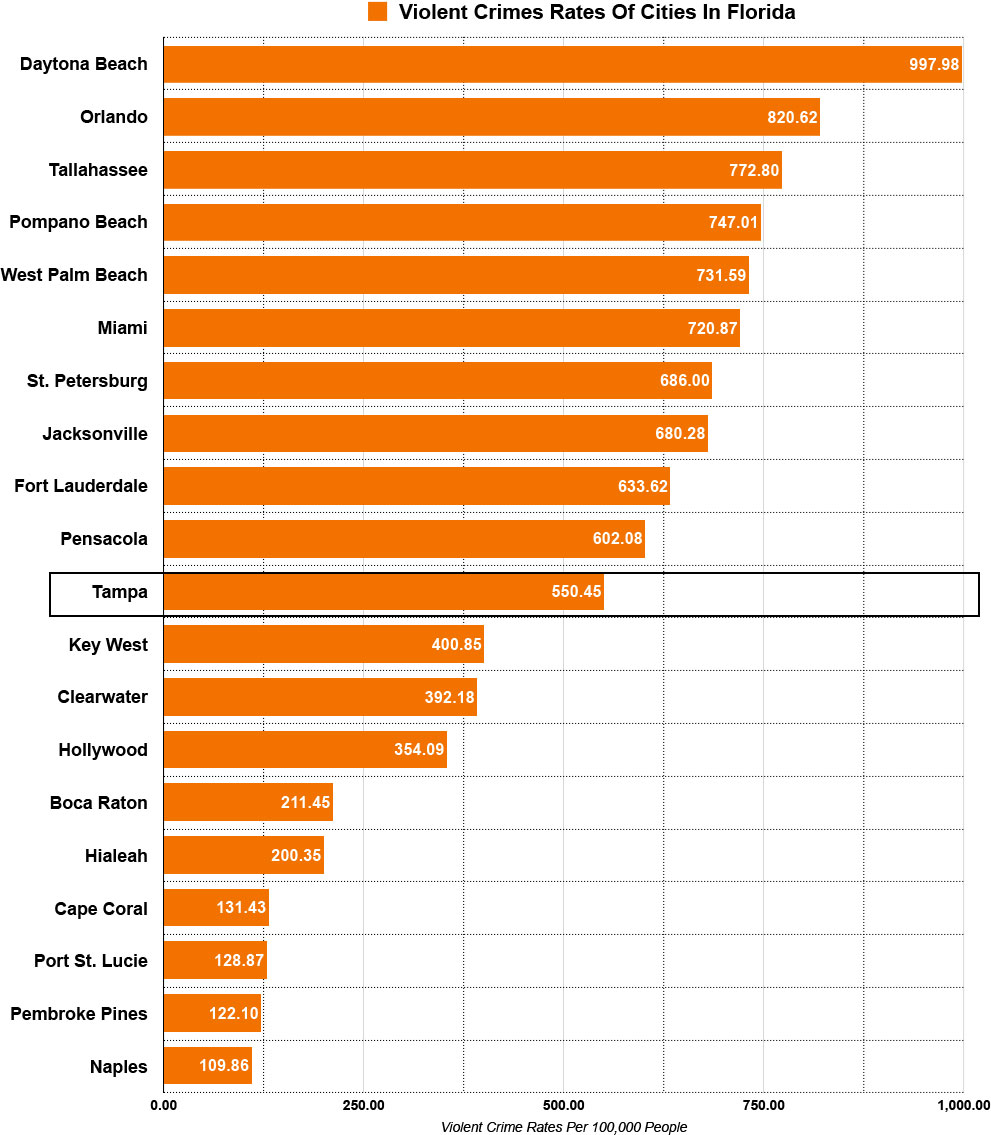
Statistically speaking, Tampa is a safe place to visit. In 2020, Tampa had a violent crime rate of 550.45 per 100,000 people. It’s violent crime rate is 1.4x greater than the national average and is on par with cities like Portland, Seattle and Fort Worth.
Here’s a scale to give you some perspective on Tampa’s violent crime rate:
Tampa, Florida Crime Stats
Here’s a breakdown of all the crimes in the city for 2020 compared to 2019:
In 2020 Tampa reported 2,119 violent crimes and had a violent crime rate of 550.45 per 100,000 people.
The national average for violent crime is 398.5 per 100,000 residents. Tampa’s violent crime rate is 1.4x greater than the national average.
Tampa’s violent crime rate is 1.4x greater than the state average.
Year over year violent crime has increased by 31%.
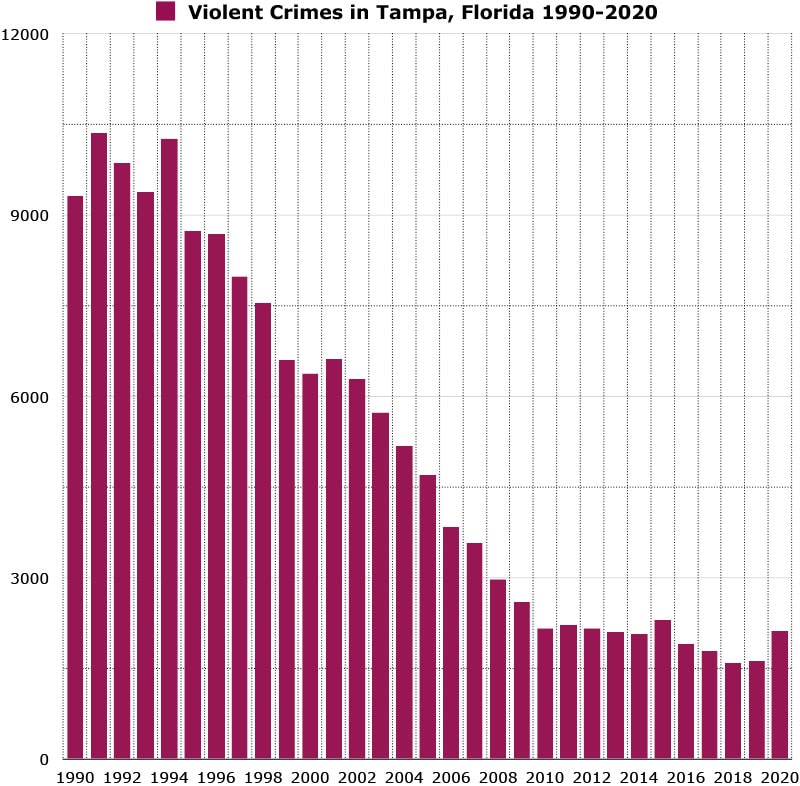
Here’s a map showing you how violent crime has trended in Tampa over a 30 year period.
Tampa’s violent crime peaked in 1991 when there was 10,357 violent crimes reported and had a violent crime rate of 3659.72 per 100,000 people.
Violent crime has decreased by 80% from it’s peak in 1991.
*Violent crimes include; homicides, rape, robbery and aggravated assaults and the violent crime rate is calculated by dividing the number of reported crimes by the total population; the result is multiplied by 100,000.
Tampa’s Property Crime Stats
In 2020 Tampa reported 5,621 property crimes and had a property crime rate of 1,460.16 per 100,000 people.
The national average for property crime is 1958.2 per 100,000 residents. Tampa’s property crime rate is roughly 25% less than the national average.
Tampa’s property crime rate is roughly 17% less than the state average.
Year over year property crime in Tampa has decreased by 17%.
Tampa property crime rate is similar to Irvine, New York and Santa Clara.
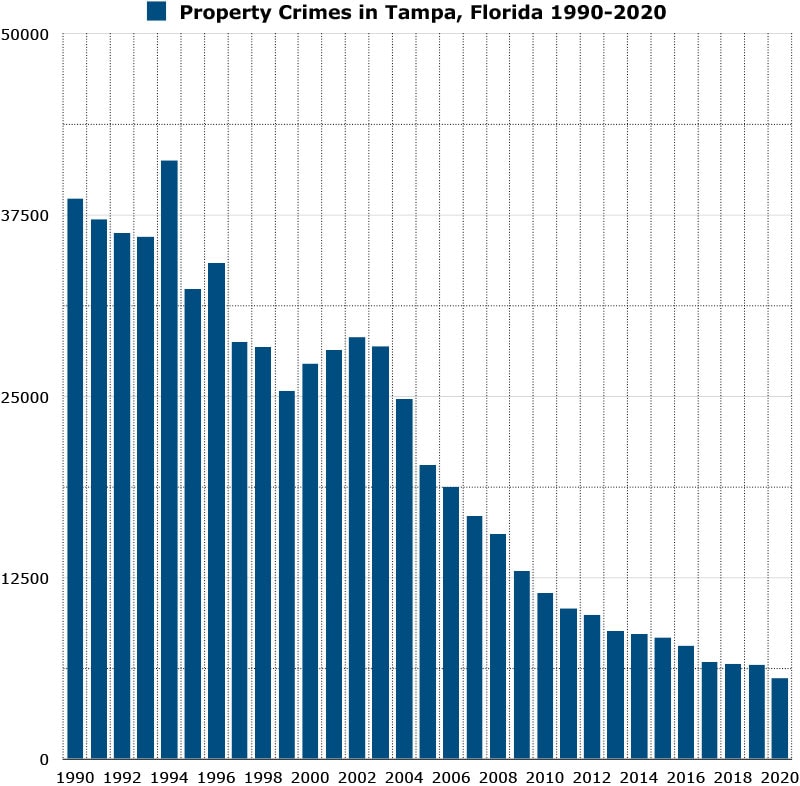
Here’s a map showing you how property crime has trended in Tampa over a 30 year period.
Property crime peaked in 1994 when there were 41,248 property crimes reported and the city had a property crime rate of roughly 14,422.38 per 100,000 people.
Property crime has decreased 86% from it’s 30-year high in 1994.
Property crime is at its lowest level in 30 years.
*Property crimes include; burglary, larceny-theft, motor vehicle theft, and arson and property crime rate is calculated by dividing the number of reported crimes by the total population; the result is multiplied by 100,000.
Tampa’s Murder Stats
In 2020, Tampa reported 41 homicides and had a homicide rate of 10.65 per 100,000 people.
41 homicides is a 32% increase from 2019 when 31 homicides were reported.
Tampa’s homicide rate is 1.6x greater than the national average and 1.8x greater than the state average.
Tampa has a similar homicide rate to cities like Phoenix, Charlotte and Minneapolis.
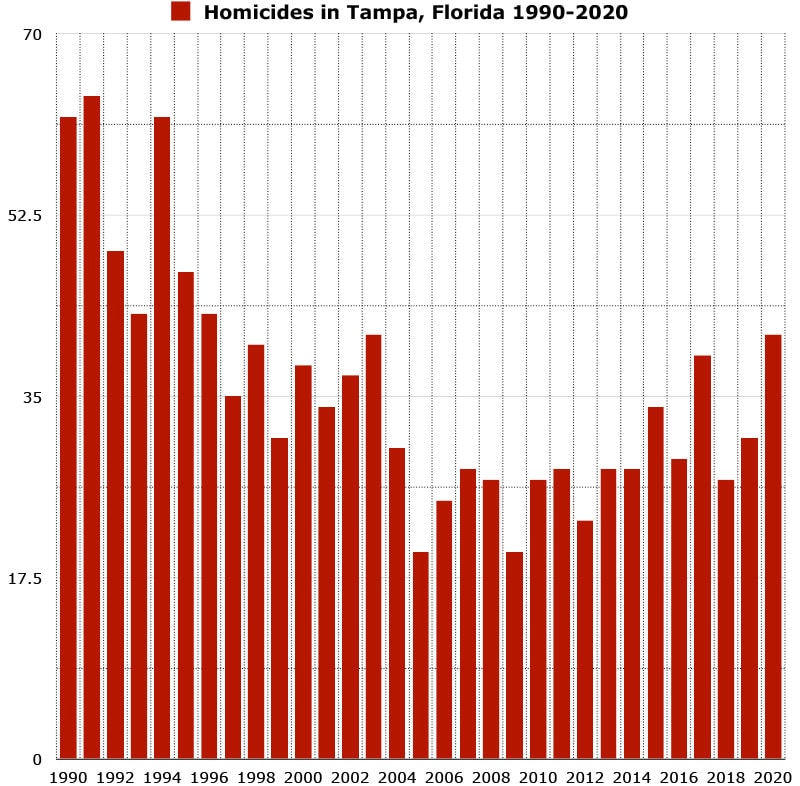
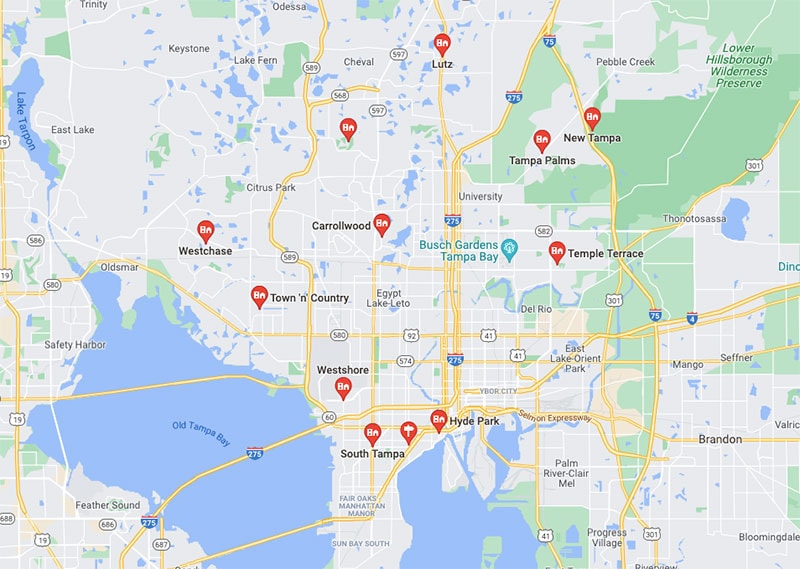
Here’s a map showing you how homicides has trended in Tampa over a 30 year period.
Homicides in Tampa peaked in 1991 when 61 homicides were reported and had a homicide rate of 22.38 per 100,000 people.
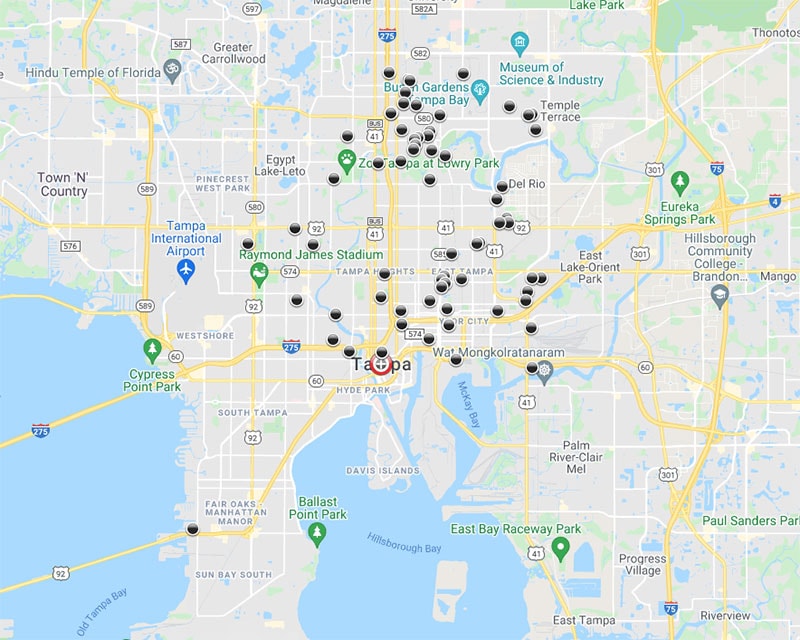
Here’s a map showing you all the homicides in Tampa from Jan 1, 2021 – Jan 1, 2022
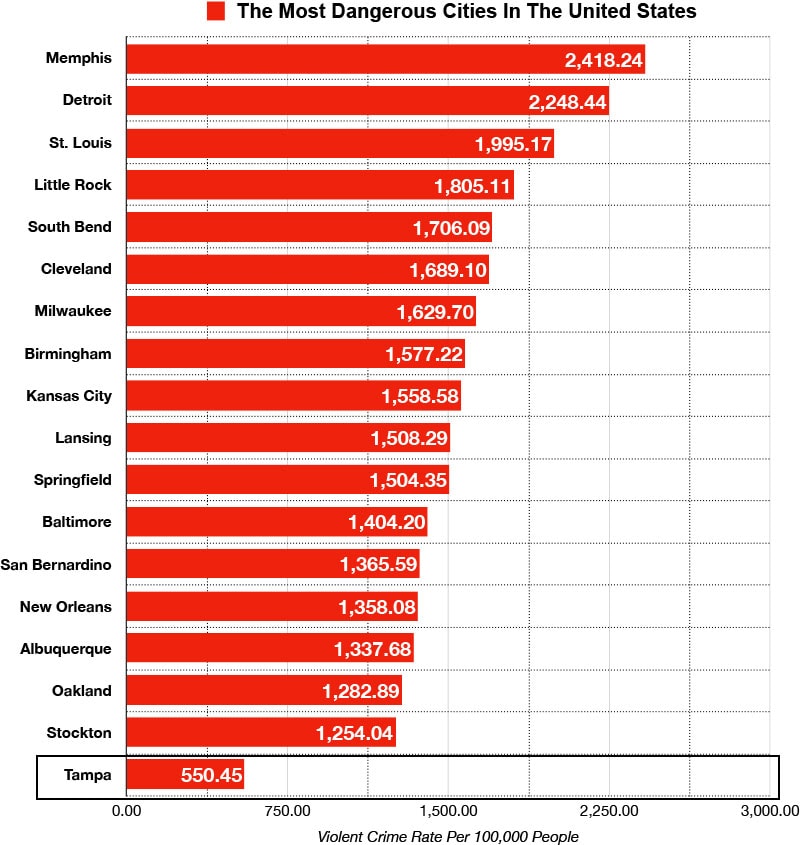
Tampa, Florida vs The Most Dangerous Cities in the United States
Here’s a list of the top 18 most dangerous cities in the United States ranked by violent crime rates. Tampa’s violent crime rate is 4.4x less than Memphis, the most dangerous city on the list.
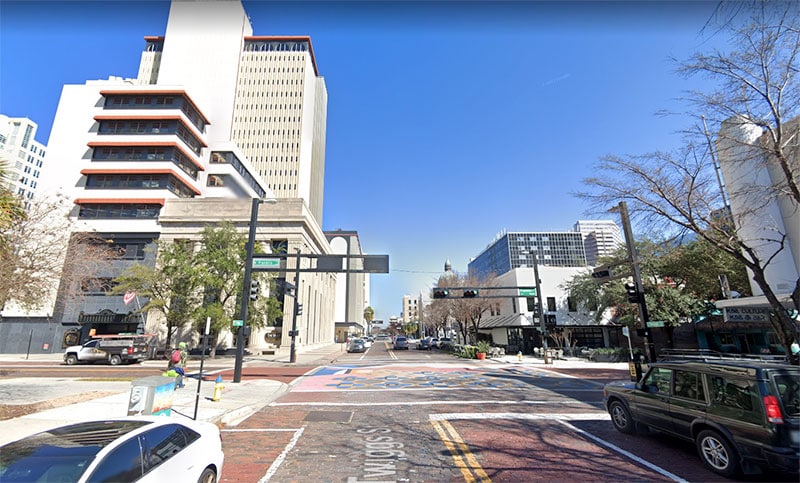
Downtown Tampa is generally a safe area to visit. At night we recommend that you take some precautions in regards to staying in well populated places, not straying off the beaten path and not walking by yourself at night.
The safest area in Downtown is along the Riverwalk. You should avoid places near the bus station (in front of The Hub, and Gaslight Park).
Many residents mention that Downtown Tampa is one of the least scary large-city downtowns they ever been in.
Is Tampa, Florida safe from hurricanes?
Tampa is susceptible to hurricanes due to its location on the coast and is something you have to take into consideration when visiting.
Historically, Tampa has been lucky in avoiding major hurricanes. The last major hurricane to hit Tampa was in 1921, which left in its wake, catastrophic destruction.
Hurricane season in Tampa officially runs from June 1 to Nov. 30. The peak of hurricane season is mid-August to mid-October.
It should be noted that hurricane season does not mean a hurricanes will occurr. They are still rare events and it just means that it is highly unusual for any hurricane to occur OUTSIDE of hurricane season.
Is it safe to visit Tampa during hurricane season?
It is safe to visit Tampa during hurricane season, as long as you don’t visit when a hurricane is about to hit! Fortunately there is usually adequate warning when a hurricane is brewing in the area.
The public transportation system in Tampa is handled by HART (Hillsborough Area Regional Transit Authority) and it offers many routes that interweave throughout Tampa and Hillsborough County.
It is generally safe during commuting hours (8am – 6pm), however we do not recommend that you take the bus at night. You should opt for a taxi or ride sharing service instead.
What do residents of Tampa say about it’s safety?
"Tampa is a great city and is generally safe."
"Avoid the Fletcher and Fowler area at all cost."
"Avoid the area on Fletcher immediately west of USF and avoid most of Hillsborough and Busch."
"Overall Tampa is pretty safe. There are some areas to avoid just like any other city."
" There’s literally no extremely bad areas in Tampa compared to cities like Compton, Baltimore, Cleveland, Detroit, or Memphis. There are some rough areas, but nowhere near those levels."
"A general rule of thumb is that north of I4 and south of MLK is rough."
"Avoid anything near Busch Gardens."
" A quick drive around town, and you will be able to identify less than desirable areas."
"The areas around USF and Busch Gardens are pretty sketchy."
Tampa is generally safe for female solo travelers as long as you learn the layout of the city, avoid problem areas, stay in well lit/well populated areas and avoid walking by yourself at night.
Is Tampa safe at night?
Tampa is safe at night as long as you stay away from the sketchy neighborhoods mentioned above. You should be able to mitigate your chances of being a victim if you study the layout of the city and avoid areas where crime is high.
Streets and squares that are perfectly safe in the day can be questionable at night. Stay where the tourists go during the day and avoid any places that are outside normal pedestrian areas at night.
Is Tampa’s tap water safe to drink?
The tap water in Tampa, Florida is safe to drink. In 2021, Tampa met or exceeded all state and federal drinking water standards.
While the tap water in Tampa meets the EPA health guidelines, it can still contain contaminants present in trace amounts that could potentially cause health issues over the long-run.
The biggest concern with tap water is immediately after a hurricane, which can disrupt the flow of clean water.
If you have any concerns about the tap water in Tampa, we suggest that you use bottle water for your drinking needs.
Tips to stay safe while visiting Tampa, Florida
Check the weather forecast a few days before you arrive. Make sure you are not arriving in the midst of a major storm system.
Do you research before you visit. Figure out which parts of the city you should avoid and book your accomodations accordingly.
Always be aware of your surroundings. When walking around time, don’t listen to music and don’t bury yourself in your headphones.
Don’t give away information about where you are staying to strangers.
Don’t drink in excess.
Don’t leave valuables in your car or in plain sight in your car.
Don’t walk by yourself at night.
Save the sightseeing for the day time.
Things To Do In Tampa According To Locals
Armature Works – Awesome food hall with a good variety of eateries.
Riverwalk – Great area to check out and take a stroll. Fanastic views everwhere you look
The Florida Aquarium – Beautifully created envionrnments for the marine life with lots of fascinating attractions.
Berns Steakhouse – If you want to splurge, Berns is a high end steak house with great vibe and atmosphere.

")
")
")
")
")
")
")
")
")
Leave a Reply