What is the Murder Capital of the United States in 2021?


What is the murder capital of the U.S. in 2021?

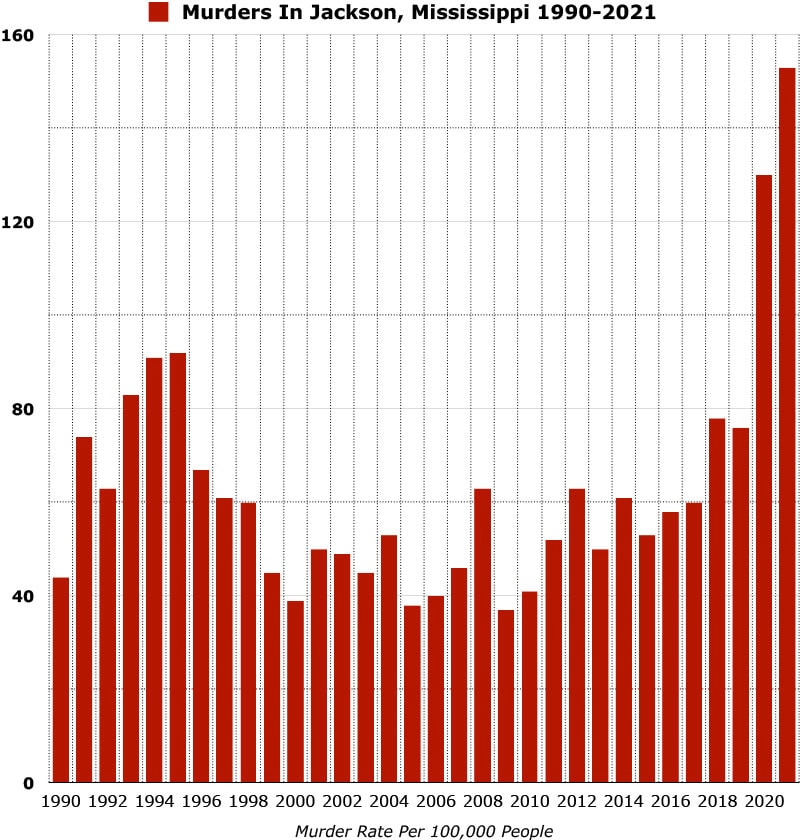
The murder capital of the United States is Jackson, Mississippi. In 2021, Jackson reported 153 murders and had a murder rate of 99.5 per 100,000 people.

Here’s a map showing you how murders have trended in Jackson, Mississippi over a 31 year period:

murder capital of the us

Why isn’t Chicago the murder capital? It has the most murders of all the cities.

Although Chicago reported the most number of murders in 2021, its per capita murder rate is significantly less than Jackson’s.

What is per capita and why is it useful when comparing cities?

In statistical analysis, per capita is a statistic that helps you compare values among groups of different sizes.

In 2021 Chicago had 836 murders, however, Chicago had 2.6 million more people than Jackson and so the per capita murder rate for Chicago is 30.4 per 100,000 people versus Jackson’s 99.5 per 100,000 people

Jackson has a murder rate that is 3.3 times more than Chicago. If Chicago were to have the same murder rate as Jackson, it would need to report 2,733 murders!

What state was the murder capital of the U.S. In 1990?

The murder capital of the United States in 1990 was Washington D.C.

In 1990 Washington D.C. reported 472 homicides and had a murder rate of 77.8 per 100,000 residents.

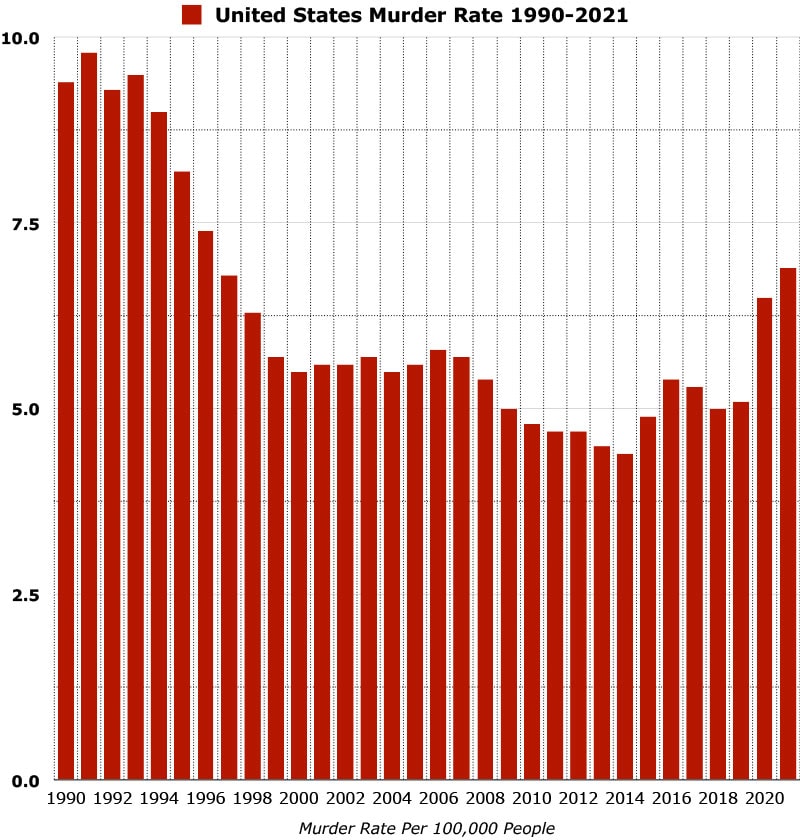
Murder rate of the United States

murder rate of the united states

Murders are on the rise in the United States. In 2021, the murder rate was estimated to be 6.9 per 100,000 people, a rate not seen since 1996 when the murder rate was 7.4 per 100,000 people.

Murders in the United States were at its lowest level in 2014, when the murder rate was 4.4. The murder rate in the United States has increased by 59% since 2014.

The most dangerous cities in the world in 2020, by murder rate per 100,000 inhabitants

Murder Rate (2020)

Los Cabos – Mexico

111.3

Caracas – Venezuela

111.2

Acapulco – Mexico

107

Natal – Brazil

102.6

Tijuana – Mexico

84.8

La Paz – Mexico

84.8

Fortaleza – Brazil

83.5

Ciudad Victoria – Mexico

83.3

Ciudad Guayana – Venezuela

80.3

Belem – Brazil

71.4

Methodology

To determine the murder capital of the United States, we compiled and computed the murder rate of 27 cities and then sorted the cities by murder rate.

We sourced population data from the Census and murder totals from various local news outlets.

We usually source crime statistics from the FBI UCR, however 2021 statistics is not yet available.

Murder rate is calculated by dividing the number of reported murders by the total population; the result is multiplied by 100,000.

Here is a table showing you the data that we drew our conclusions from:

City

Total Murders 2021

Murders per 100,000 people, 2021

1. Jackson, Mississippi

153

99.5

2. Louisville, Kentucky

188

76.4

3. Alexandria, Louisiana

34

75.6

4. Flint, Michigan

60

73.8

5. Pine Bluff, Arkansas

29

70.7

6. Birmingham, Alabama

132

65.8

7. Gary, Indiana

48

64.7

8. St. Louis, Missouri

194

64.3

9. Baltimore, Maryland

337

57.5

10. New Orleans, Louisiana

218

56.8

11. Wilmington Deleware

39

55.0

12. Memphis, Tennesse

342

54

13. Baton Rouge, Louisiana

121

53.2

14. Detroit, Michigan

309

48.9

15. Shreveport, Lousisiana

86

45.8

16. Cleveland, Ohio

170

45.6

17. Trenton, New Jersey

40

43.9

18. Saginaw, Michigan

19

43.2

19. Harrisburg, Pennsylvania

21

41.9

20. Portsmouth, Virginia

36

36.7

21. Philadelphia, Pennsylvania

551

34.4

22. Milwaukee, Wisconsin

197

34.2

23. Washignton D.C.

226

32.4

24. Chicago, Illinois

836

30.4

25. Indianapolis, Indiana

271

30.4

26. Oakland, California

134

30.3

27. Kansas City, Missouri

155

30.2

Quick Facts About Jackson, Mississippi


Jackson, Mississippi

United States

Population, Census, April 1, 2020

153,701

331,449,281

Population, Census, April 1, 2010

173,514

308,745,538

Persons under 5 years, percent

7.1%

6.0%

Persons under 18 years, percent

25.1%

22.3%

Persons 65 years and over, percent

12.4%

16.5%

Female persons, percent

53.9%

50.8%

Black or African American alone, percent

82.2%

13.4%

American Indian and Alaska Native alone, percent

0.1%

1.3%

Asian alone, percent

0.3%

5.9%

Native Hawaiian and Other Pacific Islander alone, percent

0.0%

0.2%

Two or More Races, percent

0.5%

2.8%

Hispanic or Latino, percent

1.4%

18.5%

White alone, not Hispanic or Latino, percent

15.6%

60.1%

Foreign born persons, percent, 2015-2019

1.2%

13.6%

Median value of owner-occupied housing units, 2015-2019

$90,700.00

$217,500.00

Median selected monthly owner costs -with a mortgage, 2015-2019

$1,090.00

$1,595.00

Median gross rent, 2015-2019

$847.00

$1,062.00

Households with a computer, percent, 2015-2019

85.9%

90.3%

Households with a broadband Internet subscription, percent, 2015-2019

77.2%

82.7%

High school graduate or higher, percent of persons age 25 years+, 2015-2019

86.4%

88.0%

Bachelor’s degree or higher, percent of persons age 25 years+, 2015-2019

27.2%

32.1%

Persons  without health insurance, under age 65 years, percent

15.6%

10.2%

In civilian labor force, total, percent of population age 16 years+, 2015-2019

62.4%

63.0%

Median household income (in 2019 dollars), 2015-2019

$38,888.00

$62,843.00

Per capita income in past 12 months (in 2019 dollars), 2015-2019

$21,906.00

$34,103.00

Persons in poverty, percent

25.4%

11.4%

Mariska Lee

Mariska is a recovering attorney who gave up her professional job to discover new perspectives of life while traveling in a 2009 Ford Transit. She has been living the van life for 3 years and has not looked back since.

Recent Posts