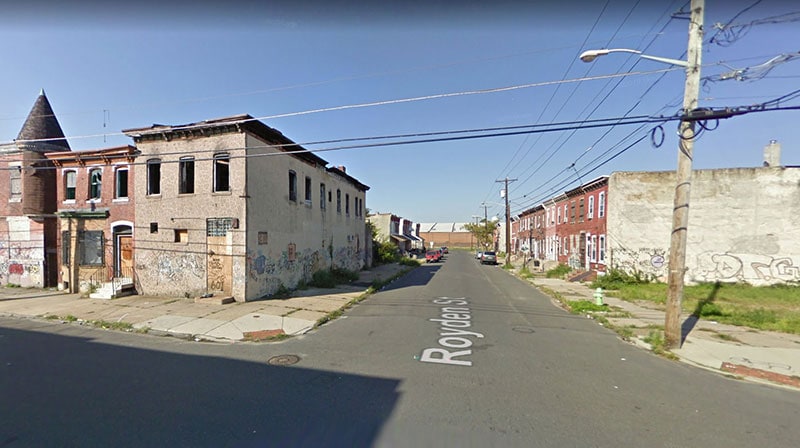
If you are thinking about visiting Camden and have some qualms about the safety of the city, we got you covered.
We are going to deep dive into the statistics, look at some maps, graphs and talk to the residents of the city to give you a better understanding of how safe Camden really is.
What happened to Camden?
By the 1950s, Camden was a bustling city, which 120,00 residents called home. Shops and businesses lined the streets. Schools were filled with happy children. Crime was low.
The city became a hub for manufacturing with companies like RCA, Campbell Soup and New York Shipbuilding employing many of the residents.
At the height of its prosperity in 1950, there were over 43,267 manufacturing jobs. By 1982 that number decreased to just 10,200.
The loss of jobs also resulted in a steady decrease in the population. In 1950 there were 124,555 residents, compared to just 84,910 in 1980.
Everyone who could leave did. That left you with the people who couldn’t – largely poor and uneducated.
Today, it’s one of the major urban-blight towns of the Rust Belt. The job sector has never recovered and any attempts to revitalize the city have failed.
There are only 71,791 people left in Camden and it is estimated that nearly 15% of all houses in Camden are unoccupied or abandoned.
The median household income is $27,015, the median value of a home is $84,100 and the poverty rate is more than 3 times the national average.
By every metric, Camden is a failed city.
Is Camden, New Jersey Safe To Visit?
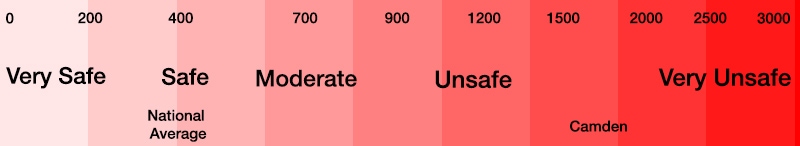
Statistically speaking, Camden is an unsafe place to visit. In 2020, Camden had a violent crime rate of 1,632.52 per 100,000 people. It’s violent crime rate is 4x greater than the national average and is 8.4x greater than the state average. It’s violent crime rate is one of the highest in the nation.
Here’s a scale to give you some perspective on Camden’s violent crime rate:
Camden, NJ Crime Stats
Here’s a breakdown of all the crimes in the city for 2020 compared to 2019:
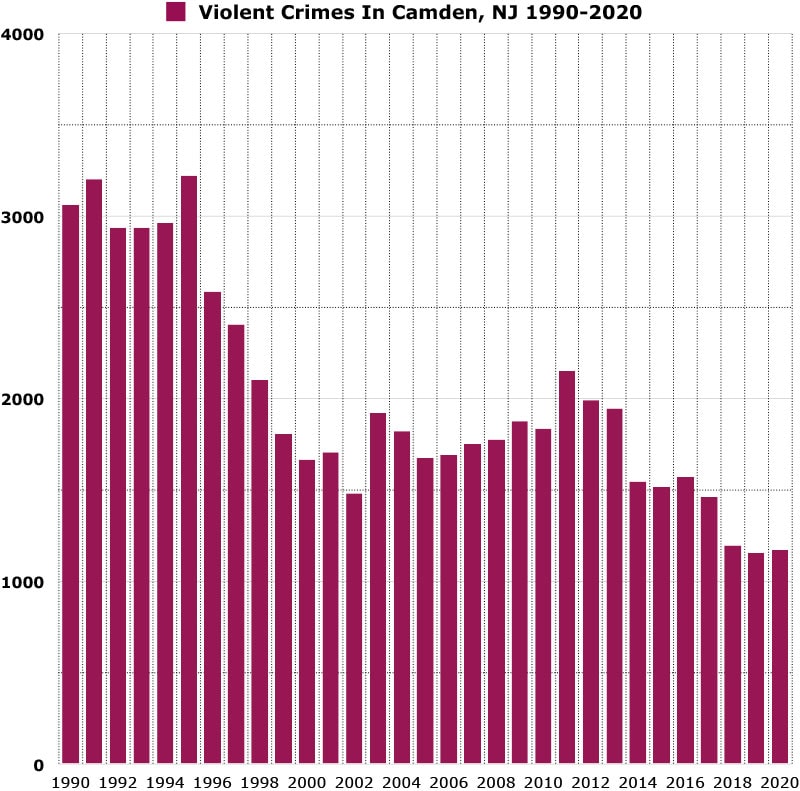
Here’s a map showing you how violent crime has trended in Camden over a 30 year period.
*Violent crimes include; homicides, rape, robbery and aggravated assaults and the violent crime rate is calculated by dividing the number of reported crimes by the total population; the result is multiplied by 100,000.
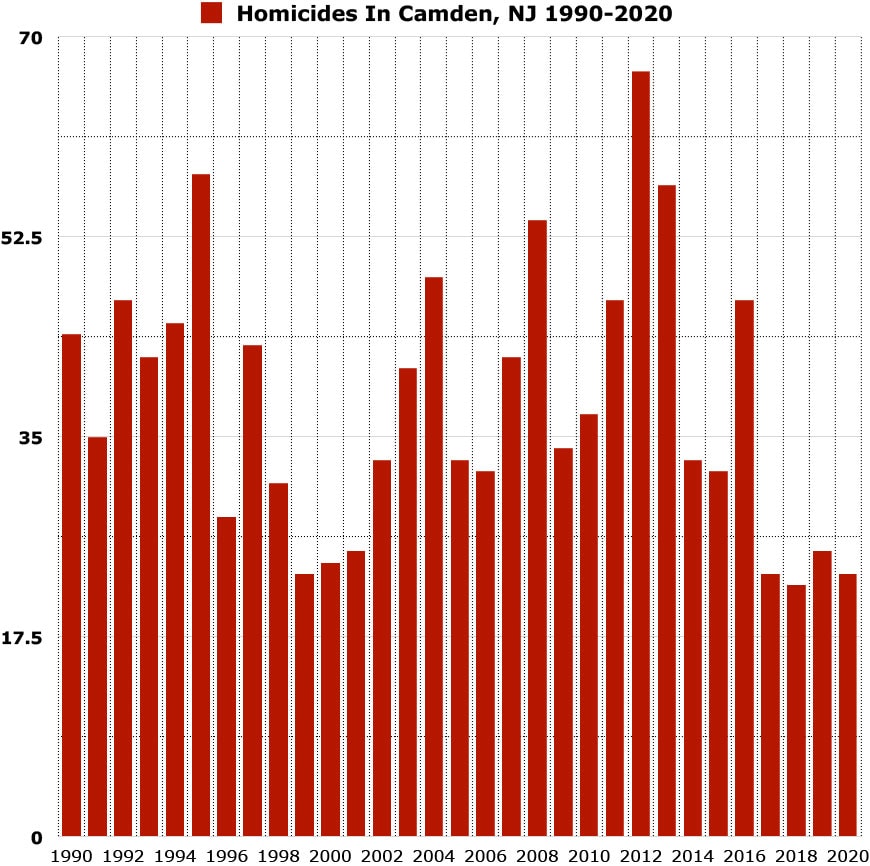
Camden’s Murder Rate
In 2020, Camden reported 23 homicides and had a homicide rate of 32.04 per 100,000 people.
Camden’s homicide rate is roughly 5x greater than the national average and 8.7x greater than the state average.
Here’s a map showing you how homicides has trended in Camden over a 30 year period.
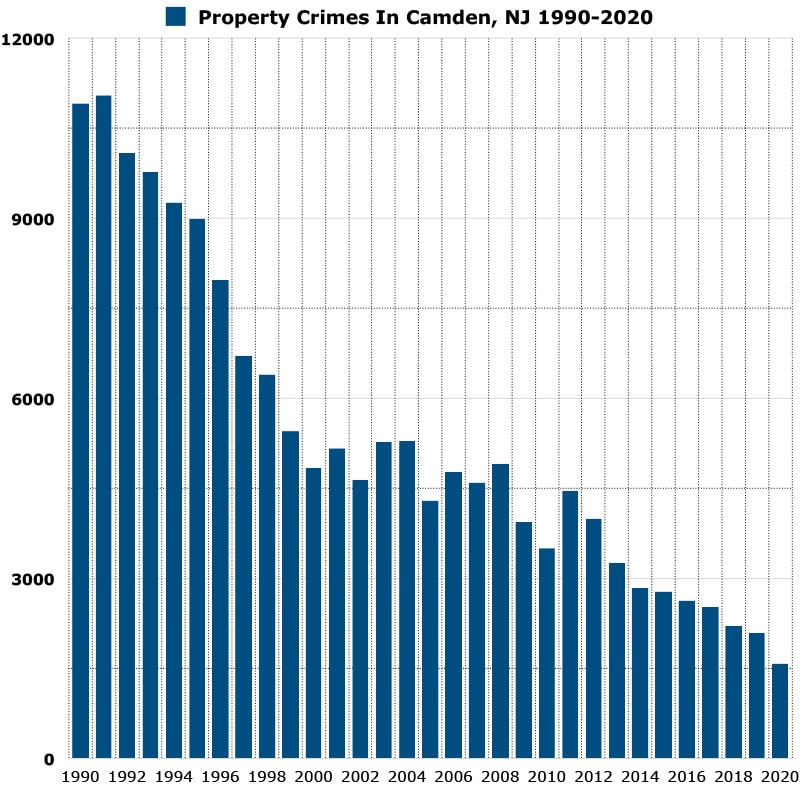
Camden’s Property Crime Rate
In 2020 Camden reported 1,579 property crimes and had a property crime rate of 2,199.44 per 100,000 people.
The national average for property crime is 1958.2 per 100,000 residents. Camden’s property crime rate is 12% higher than the national average.
Camden’s property crime rate is roughly 1.9x greater than the state average.
Year over year property crime in Camden has decreased by 33%.
Camden’s property crime rate is similar to Scottsdale, Fremont and Mesa.
Property crime is at its lowest level in 30 years.
Here’s a map showing you how property crime has trended in Camden over a 30 year period.
*Property crimes include; burglary, larceny-theft, motor vehicle theft, and arson and property crime rate is calculated by dividing the number of reported crimes by the total population; the result is multiplied by 100,000.
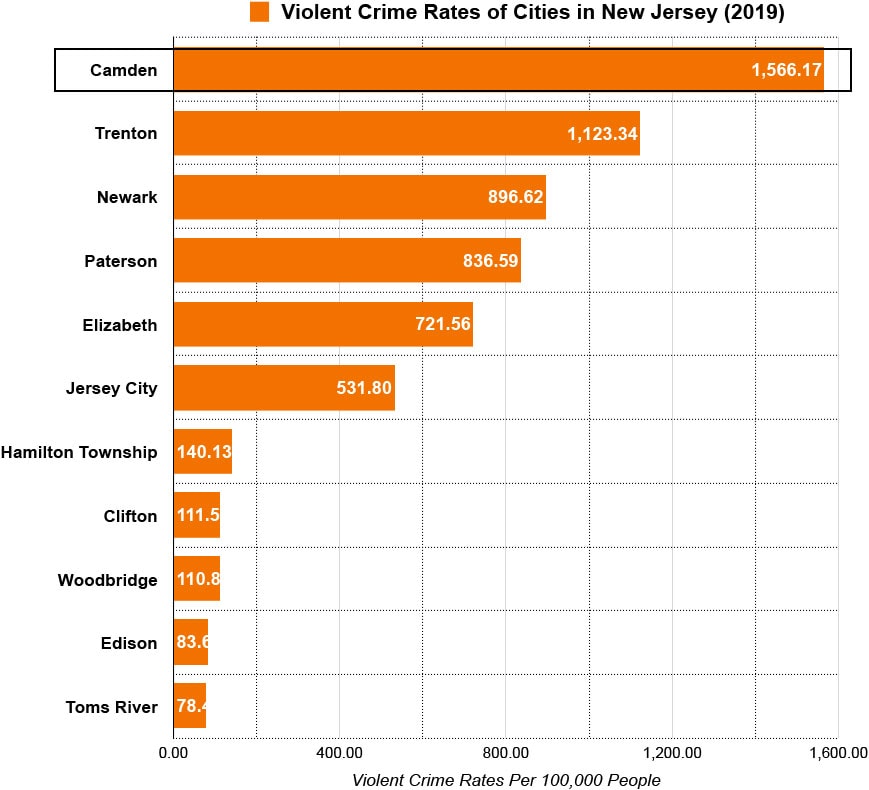
Camden vs Other Cities In New Jersey
Here’s a graph showing you the violent crime rates of the 11 most populous cities in New Jersey. Camden had the highest violent crime rate of all cities.
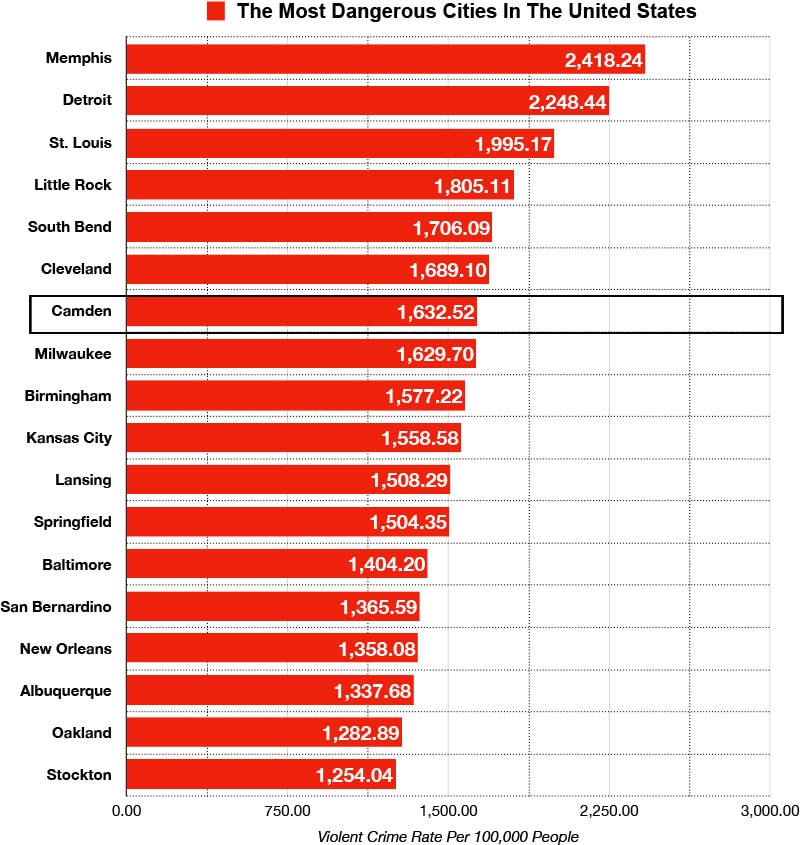
Camden, New Jersey vs The Most Dangerous Cities in the United States
Here’s a list of the top 18 most dangerous cities in the United States ranked by violent crime rates. Camden had the 7th highest violent crime rate in the country.
Residents of Camden mention that the area around Rutgers is probably the best area in the city. However, best does not mean safe. ‘Best’ is relative to the rest of the city.
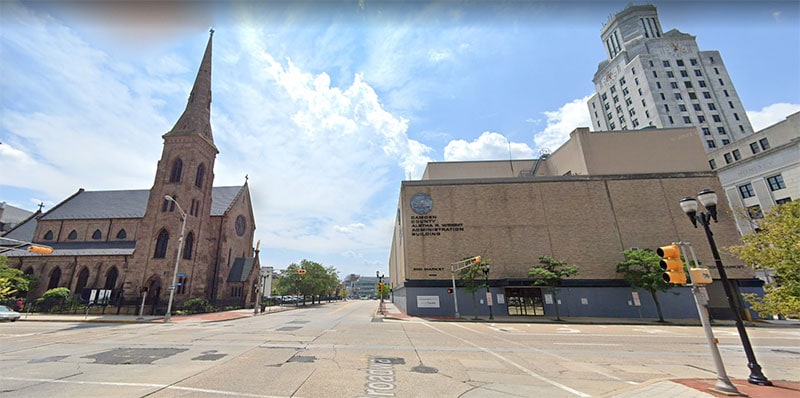
Is Downtown Camden, New Jersey Safe?
Downtown Camden is generally a safe area to visit during the day time. However, downtown is not a place you want to be around at night. There is not many people around and there is very little going on, unless there is an event at the BB&T Pavilion.At night, downtown is dangerous.
Is the public transportation in Camden safe?
The public transportation system in Camden is handled by NJ Transit and it offers many routes that interweave throughout the entire city and its surrounding neighborhoods. However, we do not recommend that you take public transportation in Camden. You should drive, opt for a taxi or ride sharing service instead.
If you have to take public transportation, please only do so during commuting hours (7 am -5 pm).
What do residents of Camden say about it’s safety?
"Camden is not as bad as people who don’t live in or work in Camden make it out to be."
"I would definitely avoid Camden. It’s definitely not a place to take the family or spend leisurely time in."
"Camden makes Detroit look like a crime free and wealthy city."
"The perception of Camden among NJ residents is that its a terrible place and that you should avoid the area at all costs. It is not a city you want to raise a family and to enjoy the outdoors, due to the danger that exists there."
"Camden is “that bad”. The crime is terrible and the conditions of the city is like a third world country in some areas."
"Camden county is pretty nice. Camden city though, is not so much."
"Camden has the reputation for being one of the worst cities in the United States."
"Camden is in a very, VERY poor condition. Crime everywhere and it seems like people have just given up on the city."
"Stay the heck away from Camden. Yes, it really is as bad as you’ve read or heard. It’s like a lawless city where anything goes."
Is Camden safe at night?
Camden is not a safe place to wander around at night. You should always know where your destination is, how to get there and how to get back. In addition, you should always drive, get a taxi or take an Uber to get to your destination. The public transportation at night can get sketchy.
Tips to stay safe while visiting Camden, New Jersey
Only visit during the daytime 7am – 5pm. Do not go sight seeing at night.
Maintain situational awareness at all times. Don’t listen to headphones and don’t bury yourself in your phone.
Walk confidently and with purpose. Avoid looking like a lost tourist.
Plan out your routes beforehand. Know how to get your destination and know how to get back.
Don’t use public transportation at night.
Make sure your gas tank is filled. You don’t want to go searching for gas in a random neighborhood in the middle of the night.
Final Thoughts
There’s no skirting around it. Camden is not a safe place to visit. The city is in a state of disrepair, abandoned building and houses line the streets and the violent crime rate is one of the highest in the nation. Even many residents agree that Camden is rough.
Camden is not a city that you can throw caution to the wind. It is a city that needs your situational awareness at all times. If you plan on visiting, visit during the daytime. We DO NOT recommend that you visit Camden at night.
Quick Facts About Camden, New Jersey
Camden, New Jersey
United States
Population, Census, April 1, 2020
71,791
331,449,281
Population, Census, April 1, 2010
77,344
308,745,538
Persons under 5 years, percent
9.0%
6.0%
Persons under 18 years, percent
30.8%
22.3%
Persons 65 years and over, percent
9.6%
16.5%
Black or African American alone, percent
41.4%
13.4%
American Indian and Alaska Native alone, percent
0.6%
1.3%
Asian alone, percent
2.4%
5.9%
Native Hawaiian and Other Pacific Islander alone, percent
0.1%
0.2%
Two or More Races, percent
4.5%
2.8%
Hispanic or Latino, percent
51.0%
18.5%
White alone, not Hispanic or Latino, percent
5.8%
60.1%
Foreign born persons, percent, 2015-2019
14.0%
13.6%
Median value of owner-occupied housing units, 2015-2019
$84,000.00
$217,500.00
Median selected monthly owner costs -with a mortgage, 2015-2019
$1,100.00
$1,595.00
Median gross rent, 2015-2019
$922.00
$1,062.00
Households with a computer, percent, 2015-2019
79.5%
90.3%
Households with a broadband Internet subscription, percent, 2015-2019
63.9%
82.7%
High school graduate or higher, percent of persons age 25 years+, 2015-2019
67.7%
88.0%
Bachelor’s degree or higher, percent of persons age 25 years+, 2015-2019
9.8%
32.1%
In civilian labor force, total, percent of population age 16 years+, 2015-2019
55.8%
63.0%
Median household income (in 2019 dollars), 2015-2019
$27,015.00
$62,843.00
Per capita income in past 12 months (in 2019 dollars), 2015-2019
")

")
")
")
")
")

Leave a Reply