If you are thinking about visiting Paterson and have some qualms about the safety of the city, we got you covered.
We are going to deep dive into the statistics, look at some maps, graphs and talk to the residents of the city to give you a better understanding of how safe Paterson really is.
Is Paterson, New Jersey Safe To Visit?
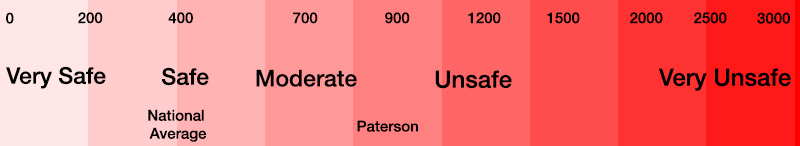
Statistically speaking, Paterson is slightly unsafe place to visit. In 2020, Paterson had a violent crime rate of 897.13 per 100,000 people. It’s violent crime rate is 2.3x greater than the national average and its murder rate of 16.9 per 100,000 people is 2.6x greater than the national average
Here’s a scale to give you some perspective on Paterson’s violent crime rate:
Paterson, NJ Crime Stats
Here’s a breakdown of all the crimes in the city for 2020 compared to 2019:
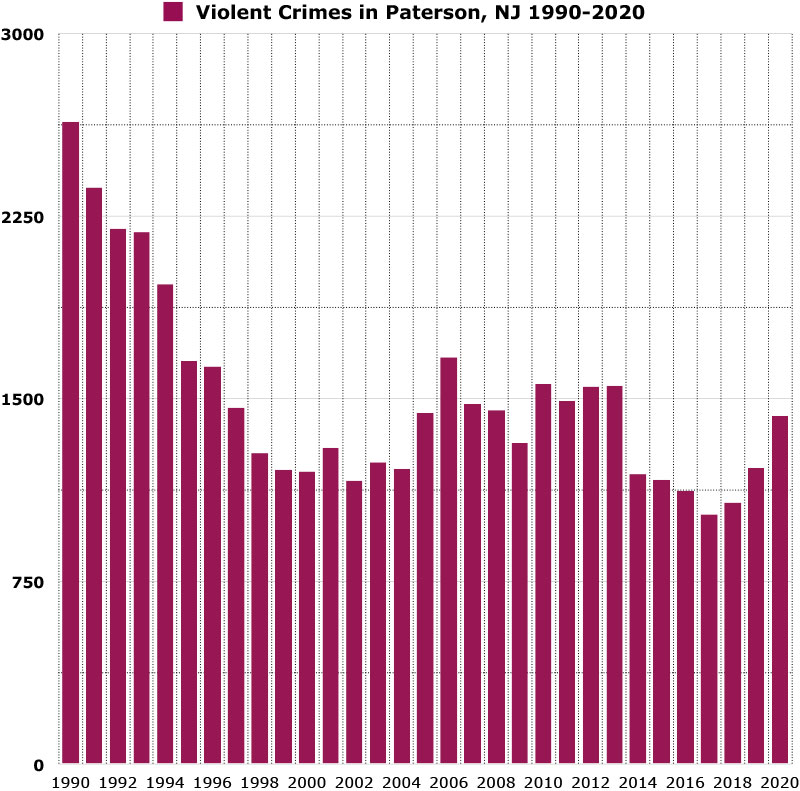
Here’s a map showing you how violent crime has trended in Paterson over a 30 year period.
*Violent crimes include; homicides, rape, robbery and aggravated assaults and the violent crime rate is calculated by dividing the number of reported crimes by the total population; the result is multiplied by 100,000.
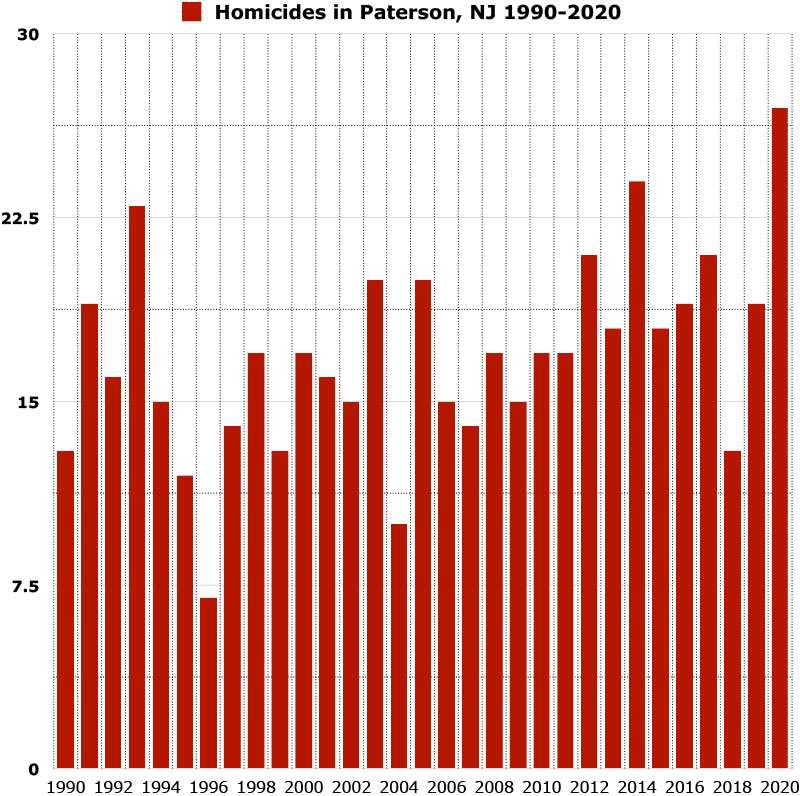
Paterson’s Murder Rate
In 2020, Paterson reported 27 homicides and had a homicide rate of 16.9 per 100,000 people.
Paterson’s homicide rate is roughly 2.6x greater than the national average and 4.6x greater than the state average.
In 2021, Paterson reported 28 homicides, which broke 2020’s record.
Here’s a map showing you how homicides has trended in Paterson over a 30 year period.
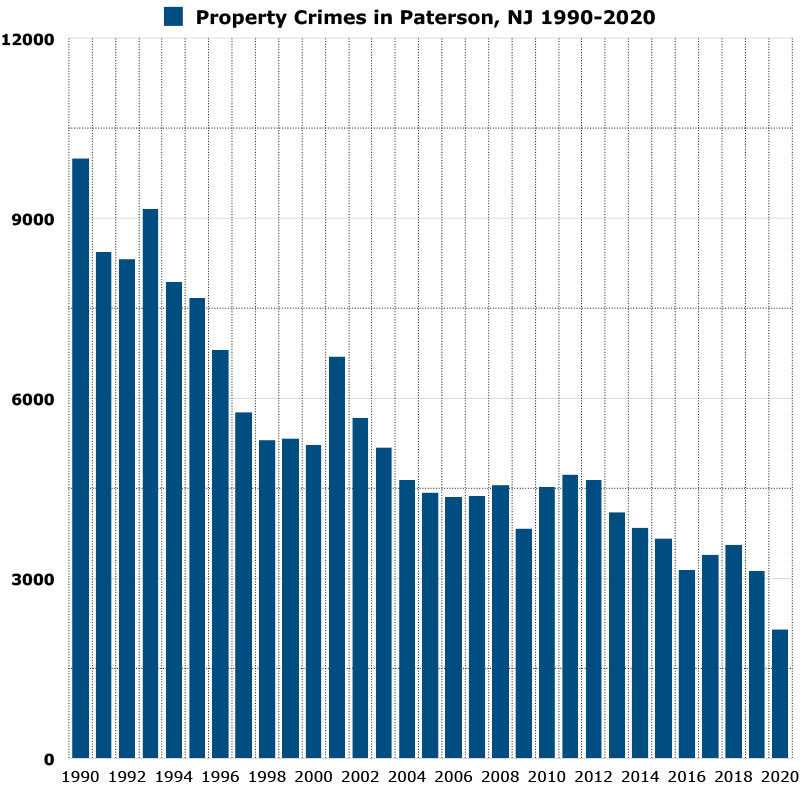
Paterson’s Property Crime Rate
In 2020 Paterson reported 2,160 property crimes and had a property crime rate of 1,352.27 per 100,000 people.
The national average for property crime is 1958.2 per 100,000 residents. Paterson’s property crime rate is 31% less than the national average.
Paterson’s property crime rate is roughly 17% greater than the state average.
Year over year property crime in Paterson has decreased by 45%.
Paterson property crime rate is similar to Irvine, Santa Clara and Gilbert.
Property crime is near its lowest level in 30 years.
Here’s a map showing you how property crime has trended in Paterson over a 30 year period.
*Property crimes include; burglary, larceny-theft, motor vehicle theft, and arson and property crime rate is calculated by dividing the number of reported crimes by the total population; the result is multiplied by 100,000.
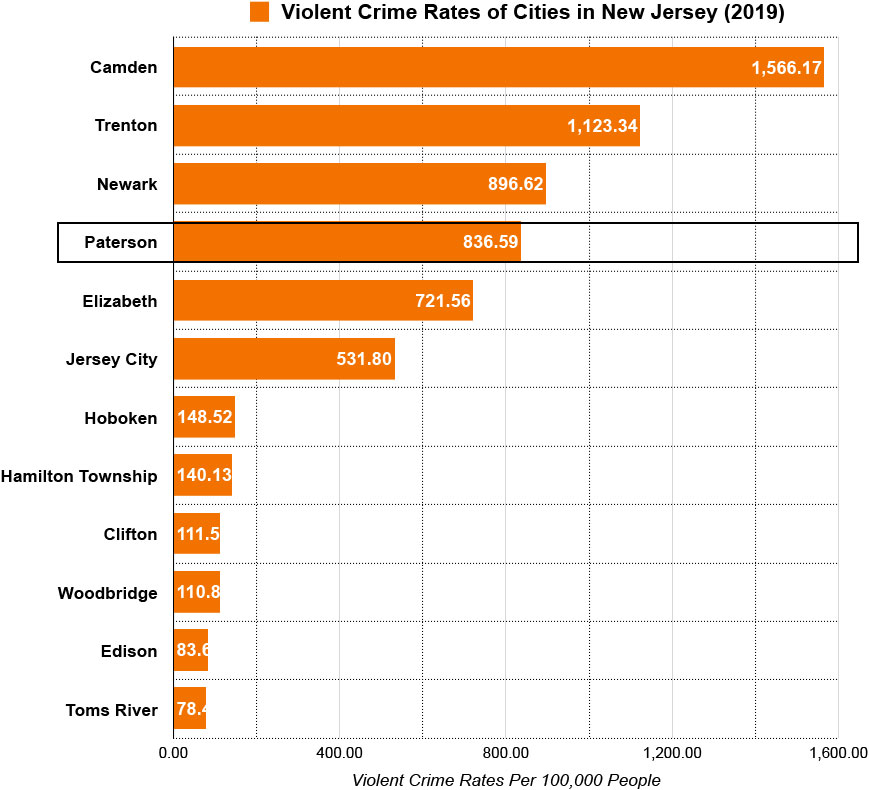
Paterson vs Other Cities In New Jersey
Here’s a graph showing you the violent crime rates of the 11 most populous cities in New Jersey. Paterson’s violent crime rate ranked 4th among all cities
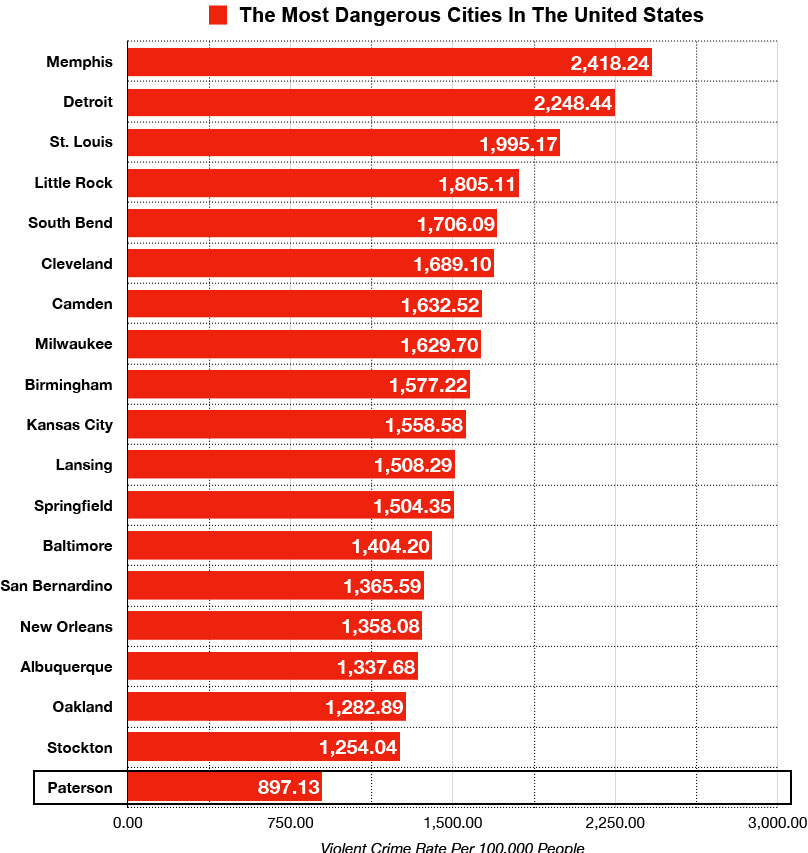
Paterson, New Jersey vs The Most Dangerous Cities in the United States
Here’s a list of the top 19 most dangerous cities in the United States ranked by violent crime rates. Paterson’s violent crime rate is 2.7x less than Memphis, the most dangerous city on the list.
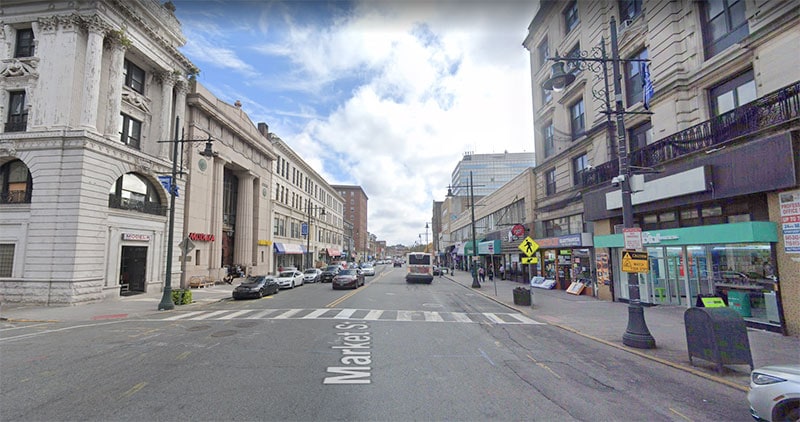
Downtown Paterson is generally safe to visit during the day time. At night the situation in downtown feel more sketchy as shops and businesses close down and people leave the area.
We recommend that you take extra precautions at night and to stay in well populated places, don’t stray off the beaten path and don’t walk by yourself at night.
Is the public transportation in Paterson safe?
The public transportation system in Paterson is handled by NJ Transit and it offers many routes that interweave throughout the entire city and into Manhattan. However, we do not recommend that you take NJ Transit late at night. There’s a lot less people around and it can get sketchy down there. Get a taxi or an Lyft instead.
What do residents of Paterson say about it’s safety?
"There’s areas in Paterson that are regular neighborhoods and you could go in daylight, while there are other area you wouldn’t want to go without a police escort any time of day."
"The whole 4th ward is known for the drugs and shootings"
"Paterson isn’t as bad as people say it is, even thought crime statistics don’t paint a rosy picture."
"Paterson’s reputation is so bad that West Paterson petitioned to have their town name changed to disassociate from Paterson."
"Stay out of east side and north Paterson and you’ll be fine."
"Paterson isn’t as horrible as Camden or Jersey City, but I still wouldn’t go there at night."
"More than 90% of my alerts are for theft, shootings, and altercations in Paterson."
Is Paterson safe at night?
Paterson is not the safest place to visit at night and it definitely is not the type of city that you won’t to be lost in at night. Streets and squares that are perfectly safe to visit in the daytime can be questionable and sketchy at night.
Tips to stay safe while visiting Paterson, New Jersey
Research the area before you arrive and book your accommodations accordingly.
Always maintain situational awareness. Keep your head on a swivel and don’t get distracted by your phone.
Plan out your routes out beforehand. Know exactly how to get to your location and back.
Save the sight seeing for the day time. The city is not a safe place to wander willy nilly at night.
Don’t leave anything of value in your car.
Don’t walk by yourself at night, especially if you are a woman. You are less likely to be a victim of crime if you are in a group of people.
Don’t use the ATM at night in sketchy locations.
Make sure you gas tank is always full. You don’t want to end up in a sketchy neighborhood looking for a gas station late at night.
Quick Facts About Paterson, New Jersey
Paterson, New Jersey
United States
Population, Census, April 1, 2020
159,732
331,449,281
Population, Census, April 1, 2010
146,199
308,745,538
Persons under 5 years, percent
7.9%
6.0%
Persons under 18 years, percent
27.3%
22.3%
Persons 65 years and over, percent
11.3%
16.5%
Black or African American alone, percent
26.1%
13.4%
American Indian and Alaska Native alone, percent
0.1%
1.3%
Asian alone, percent
4.6%
5.9%
Native Hawaiian and Other Pacific Islander alone, percent
0.0%
0.2%
Two or More Races, percent
3.8%
2.8%
Hispanic or Latino, percent
60.8%
18.5%
White alone, not Hispanic or Latino, percent
8.5%
60.1%
Foreign born persons, percent, 2015-2019
40.6%
13.6%
Median value of owner-occupied housing units, 2015-2019
$244,200.00
$217,500.00
Median selected monthly owner costs -with a mortgage, 2015-2019
$2,340.00
$1,595.00
Median gross rent, 2015-2019
$1,193.00
$1,062.00
Households with a broadband Internet subscription, percent, 2015-2019
69.0%
82.7%
High school graduate or higher, percent of persons age 25 years+, 2015-2019
74.8%
88.0%
Bachelor’s degree or higher, percent of persons age 25 years+, 2015-2019
11.1%
32.1%
In civilian labor force, total, percent of population age 16 years+, 2015-2019
60.3%
63.0%
Median household income (in 2019 dollars), 2015-2019
$41,360.00
$62,843.00
Per capita income in past 12 months (in 2019 dollars), 2015-2019
")
")
")
")
")
")
")
")
")
Leave a Reply