If you are thinking about visiting Aurora and have some qualms about the safety of the city, we got you covered.
We are going to deep dive into the statistics, look at some maps, graphs and talk to the residents of the city to give you a better understanding of how safe Aurora really is.
Is Aurora, Colorado Safe To Visit?
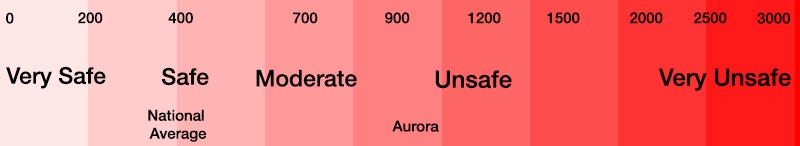
Statistically speaking, Aurora is a moderately safe place to visit. In 2021, Aurora had a violent crime rate of 997.88 per 100,000 people. Aurora violent crime rate is 2.5x greater than the national average and is comparable to cities like Chicago, Philadelphia and Washington D.C.
Here’s a scale to give you some perspective on Aurora’s violent crime rate:
Aurora, Colorado Crime Stats
Here’s a breakdown of all the crimes in the city for 2020 compared to 2019:
In 2021 Aurora reported 3,923 violent crimes and had a violent crime rate of 997.88 per 100,000 people.
Aurora’s violent crime rate is 2.4x greater than the state average.
Year over year violent crime has increased by 15%.
*Violent crimes include; homicides, rape, robbery and aggravated assaults and the violent crime rate is calculated by dividing the number of reported crimes by the total population; the result is multiplied by 100,000.
Aurora’s Murder Rate
In 2020, Aurora reported 44 murders and had a murder rate of 11.19 per 100,000 people.
Aurora’s homicide rate is 1.7x greater than the national average and 2.2x greater than the state average.
*Property crimes include; burglary, larceny-theft, motor vehicle theft, and arson and property crime rate is calculated by dividing the number of reported crimes by the total population; the result is multiplied by 100,000.
Aurora vs Other Cities In Colorado
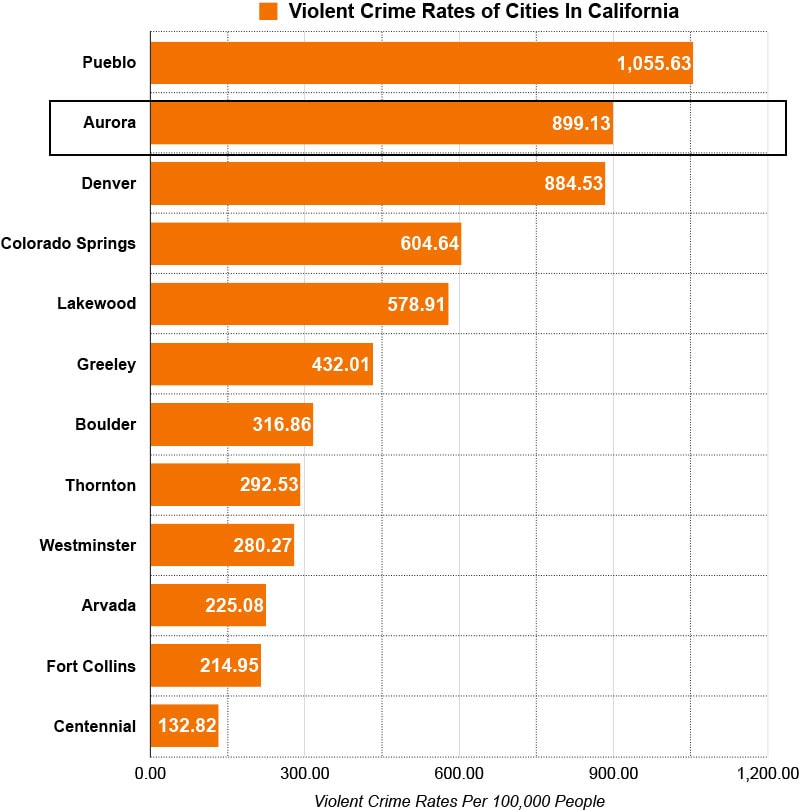
Here’s a graph showing you the violent crime rates of the most populous cities in Colorado. Aurora’s violent crime rate ranked 2nd highest among all cities.
City
Population
Violent Crime Rate
Pueblo
111,876
1,055.63
Aurora
386,261
899.13
Denver
715,522
884.53
Colorado Springs
478,961
604.64
Lakewood
155,984
578.91
Greeley
108,795
432.01
Boulder
108,250
316.86
Thornton
141,867
292.53
Westminster
116,317
280.27
Arvada
124,402
225.08
Fort Collins
169,810
214.95
Centennial
108,418
132.82
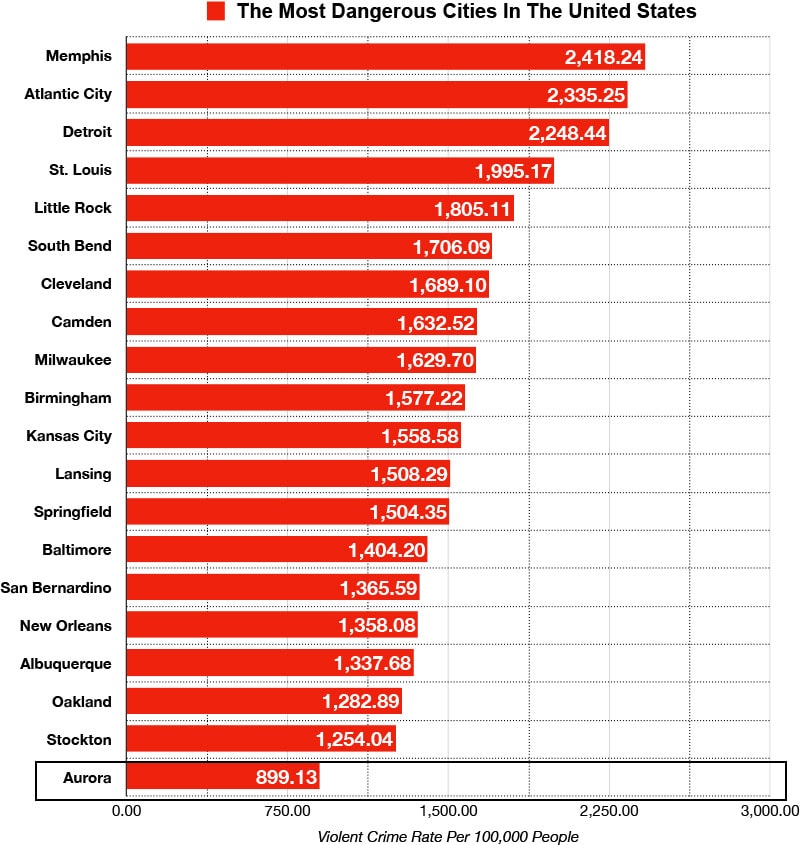
Aurora, Colorado vs The Most Dangerous Cities in the United States
Here’s a list of the top 19 most dangerous cities in the United States ranked by violent crime rates. Aurora’s violent crime rate had the second highest rate, only trailing Memphis.
The public transportation system in Aurora is handled by RTD and it offers many routes that interweave throughout the entire city and throughout Denver. The RTD is generally safe to use during the commuting hours (7am – 7pm), however we do not recommend that you use RTD late at night.
What do residents of Aurora say about it’s safety?
"I’ve lived in Aurora since 2007 and I’ve never had any issues and never felt."
"Avoid Colfax Ave. The further away you are from there, the better."
"Generally speaking, the further south you go in Aurora the better the neighborhoods."
"Your quality of living will is inversely proportional to how close you are to Colfax Ave."
"In Aurora, the further East and South you go, the safer and better."
"I used to live in North Aurora, but I broke my lease because the area was awful."
"Aurora is a big place. But for most of it, yes it is safe."
"Aurora is generally safe. Even the bad parts of Aurora is safe if you compare it to places like in Detroit or Baltimore."
Is Aurora safe at night?
Aurora is generally safe at night as long as you avoid the problem areas, specifically the area surrounding Colfax ave. Also be aware that streets and squares that are perfectly safe to visit in the daytime can be questionable and sketchy at night.
At night we recommend that you take a few extra precautions by staying in well populated places, not straying off the beaten path and not walking by yourself.
Tips to stay safe while visiting Aurora, Colorado
Research the area thoroughly before you arrive. Make sure you didn’t book your accommodations in a sketchy neighborhood. Google street view is your friend.
Keep your head up, walk with confidence and purpose. People are more likely to mess with someone who is timid, unsure and lost.
Avoid walking through dark alleys or hidden locations, especially at night time. Stay in well lit and well populated areas.
Avoid drinking in excess. Know your limits and stick to them.
When walking, don’t bury your head in your phone. Keep your head up and discreetly look at your phone if you need directions.
Don’t wear anything to make yourself stand out. Leave the expensive clothing, jewelry, watches, purses, accessories at home.
Don’t leave anything valuable in your car or in plain sight in your car.
Don’t give strangers detailed information about where you are staying.
Map out your destinations before you leave. You need to know where you are going and how to get back. Don’t just wing it.
Quick Facts About Aurora, Colorado
Aurora, Colorado
United States
Population, Census, April 1, 2020
386,261
331,449,281
Population, Census, April 1, 2010
325,078
308,745,538
Persons under 5 years, percent
7.0%
6.0%
Persons under 18 years, percent
25.3%
22.3%
Persons 65 years and over, percent
11.2%
16.5%
Black or African American alone, percent
16.5%
13.4%
American Indian and Alaska Native alone, percent
0.9%
1.3%
Asian alone, percent
6.5%
5.9%
Native Hawaiian and Other Pacific Islander alone, percent
0.4%
0.2%
Two or More Races, percent
5.2%
2.8%
Hispanic or Latino, percent
28.6%
18.5%
White alone, not Hispanic or Latino, percent
44.4%
60.1%
Owner-occupied housing unit rate, 2015-2019
59.9%
64.0%
Median value of owner-occupied housing units, 2015-2019
$290,000.00
$217,500.00
Median selected monthly owner costs -with a mortgage, 2015-2019
$1,617.00
$1,595.00
Median gross rent, 2015-2019
$1,328.00
$1,062.00
High school graduate or higher, percent of persons age 25 years+, 2015-2019
87.7%
88.0%
Bachelor’s degree or higher, percent of persons age 25 years+, 2015-2019
29.7%
32.1%
In civilian labor force, total, percent of population age 16 years+, 2015-2019
71.3%
63.0%
Median household income (in 2019 dollars), 2015-2019
$65,100.00
$62,843.00
Per capita income in past 12 months (in 2019 dollars), 2015-2019

")
")
")
")

")
")
")
")
Leave a Reply