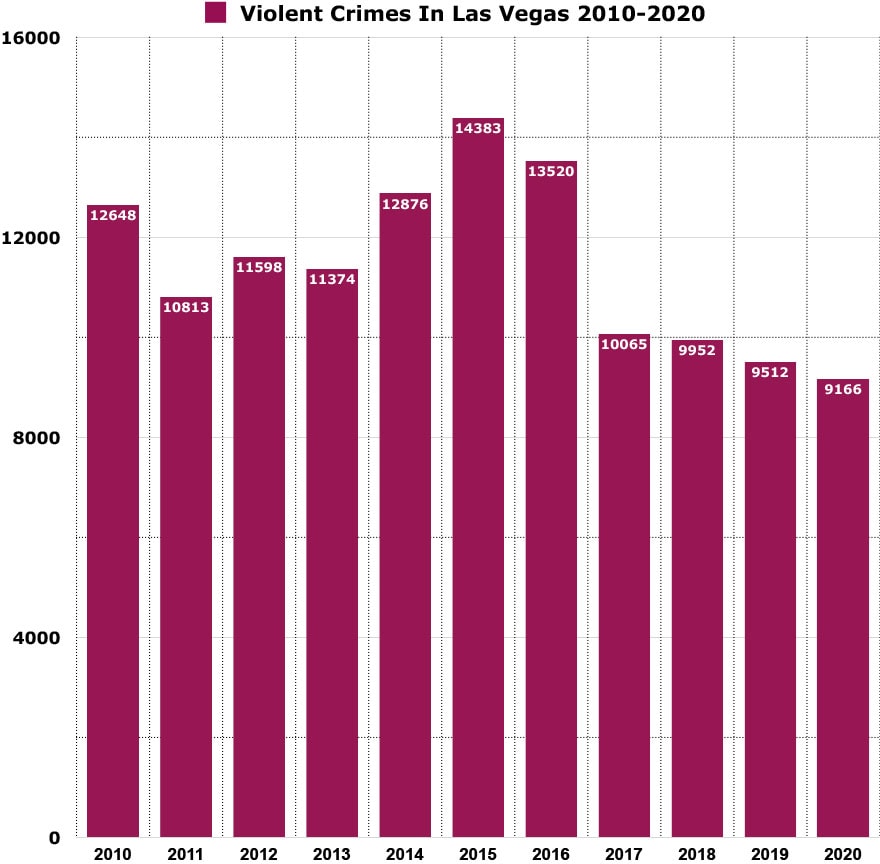
In 2020 Las Vegas reported 9,166 violent crimes and had a crime rate of 545.47 per 100,000 residents. Violent crime in the city decreased 4 percent last year compared with 2019.
Las Vegas’ violent crime rate is 1.4x times greater than the national average.
You have a 1 in 183 chance of becoming a victim of violent crime in Las Vegas.
Here’s a map showing you how violent crime has trended in Las Vegas over a 11 year period.
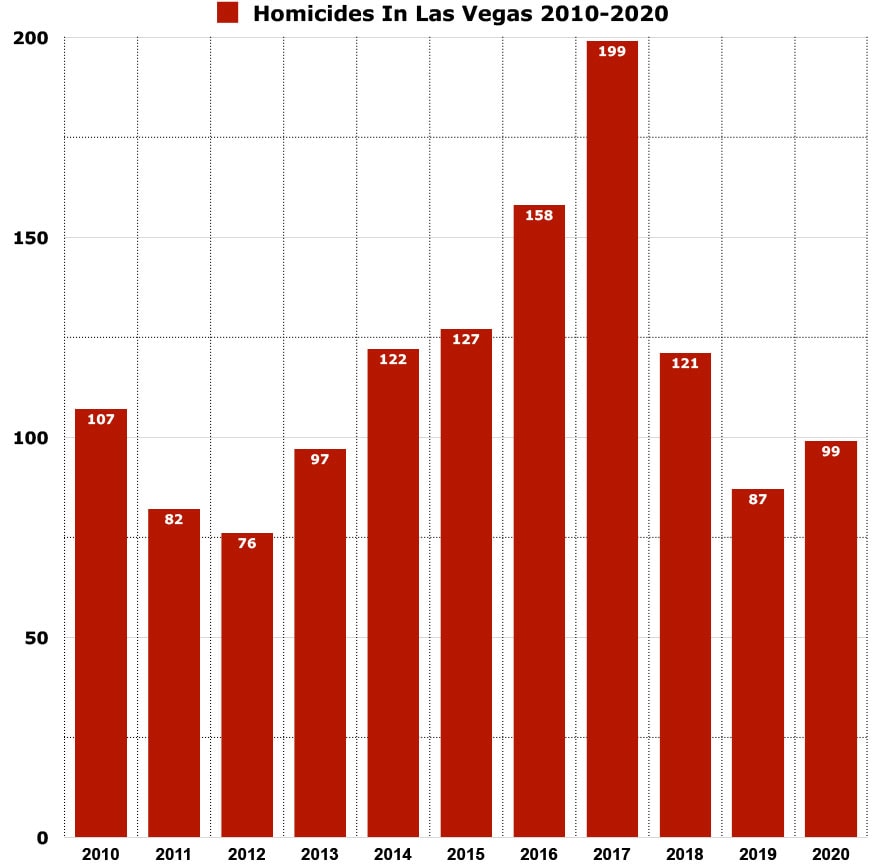
Las Vegas’s Murder Rate
In 2020, Las Vegas reported 99 murders and had a murder rate of 5.89 per 100,000 residents.Murders in the city increased 14 percent last year compared with 2019.
Las Vegas’ murder rate is roughly 10% less than the national average.
Here’s a map showing you how murders have trended over the last 11 years in Las Vegas
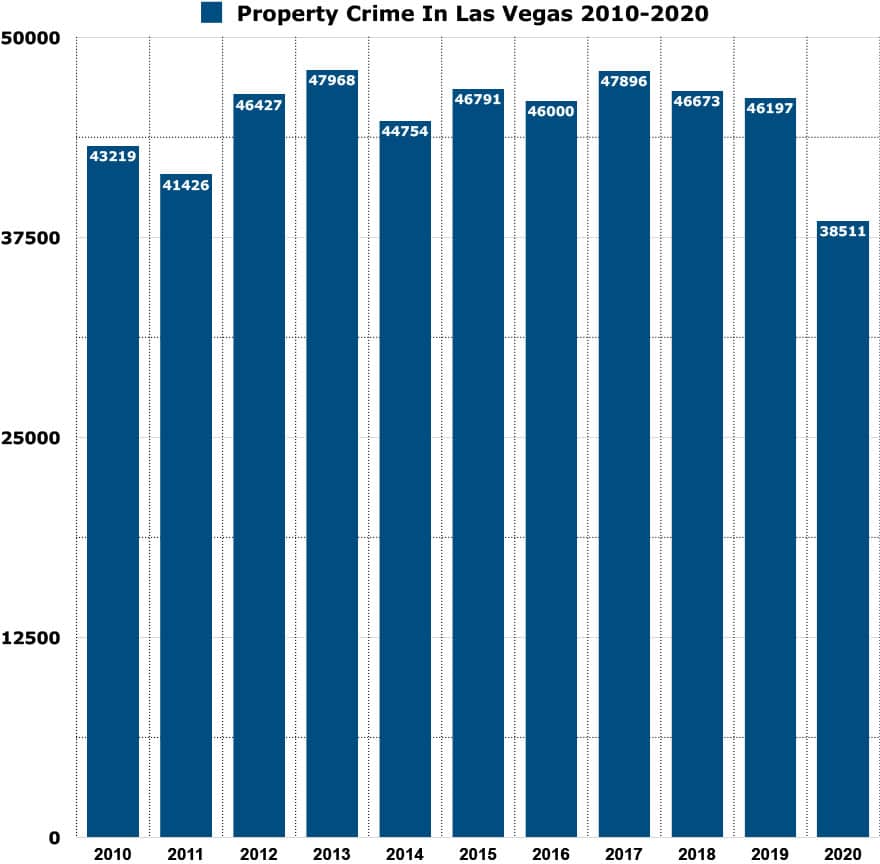
Las Vegas Property Crime Rate
In 2020 Las Vegas reported 38,511 property crimes and had a property crime rate of 2,291.79 per 100,000 residents. Property crimes in the city decreased 17 percent last year compared with 2019.
Las Vegas’ property crime rate is 17% times greater the national average.
Las Vegas has a similar property crime rate to San Jose and Newark.
You have a 1 in 44 chance of becoming a victim of property crime in Las Vegas.
Here’s a map showing you how property crime has trended in Las Vegas over a 11 year period.
Las Vegas’s crime rate vs other cities in Nevada (2020)
Here’e how Las Vegas’ violent crime rate compared to other cities in Nevada.
Cities
Population
Violent Crime Rate (2020)
Las Vegas
641,903
545.47
Reno
264,165
552.68
North Las Vegas
262,527
509.28
Sparks
108,445
411.27
Carson City
58,639
368.36
Henderson
317,610
214.73
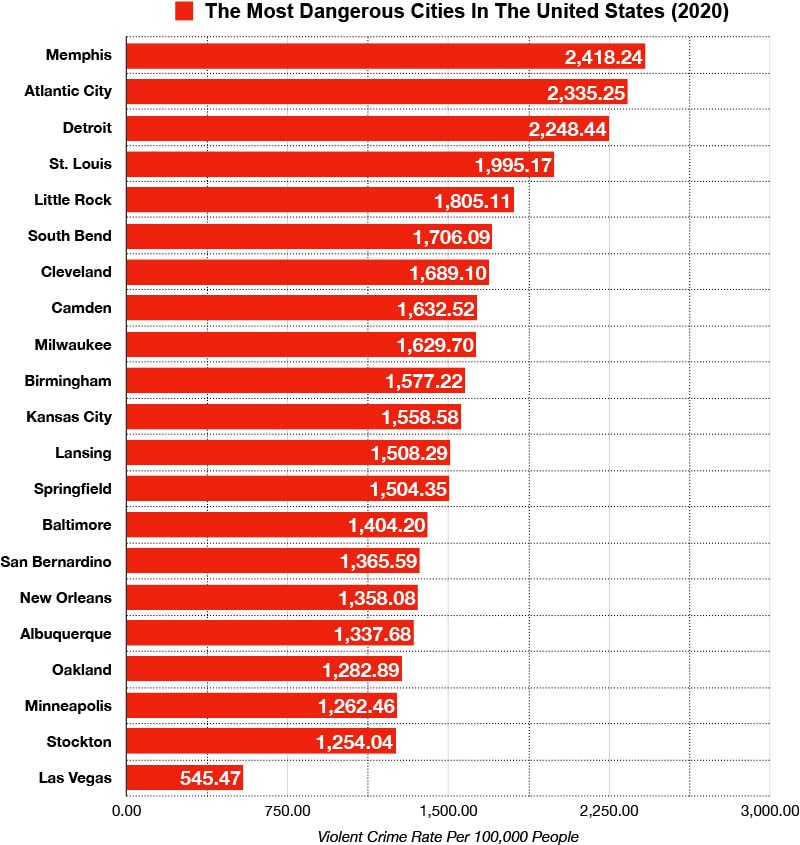
Las Vegas Crime Rate Comparison
Here’s a list of the top 20 most dangerous cities in the United States ranked by violent crime rates. Las Vegas’s crime rate is 4.4x less than Memphis, the most dangerous city on the list.
Facts about Las Vegas, NV
The population of Las Vegas Metro in 2020 is roughly 1,680,389.
The city covers a land area of 142 square miles.
The racial makeup of the city: 33.1% Hispanic or Latino, 43.5% White, 12.2% African American, 0.9% Native American, 6.9% Asian, and 5.2% from two or more races.
The median age is 34 years old.
The median income for a household in the city was $56,354. The per capita income for the city was $30,761.
15.3% of the population live below the poverty line.
The median home value in Las Vegas is $399,108 in 2022.
In 2022, the average rent for a Las Vegas 2-bedroom apartment is $1915.
84.8% of residents 25 and older is a high school graduate. 24.6% of residents 25 and older has a bachelors degree or higher.
12.9% of residents identified as gay, lesbian, or bisexual.


")

")
")
")
")
")
Leave a Reply