No city in Texas embodies the motto "Everything is bigger in Texas" better than the city of Dallas. Dallas is the second most populous city in Texas and home to the Cowboys, the Mavericks and a slew of other professional sports teams. It is a well rounded city with arts, music, culture and people of all walks of life.
If you are thinking about visiting Dallas and have qualms about the safety of the city, we got you covered. We deep dived into the statistics, crime reports and talked to the residents of the city to give you a better understanding of how safe the safe the city really is.
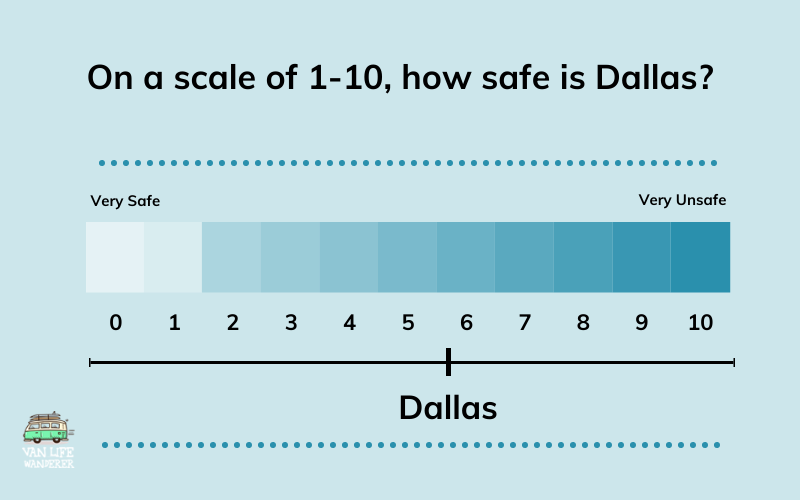
Is Dallas Safe?
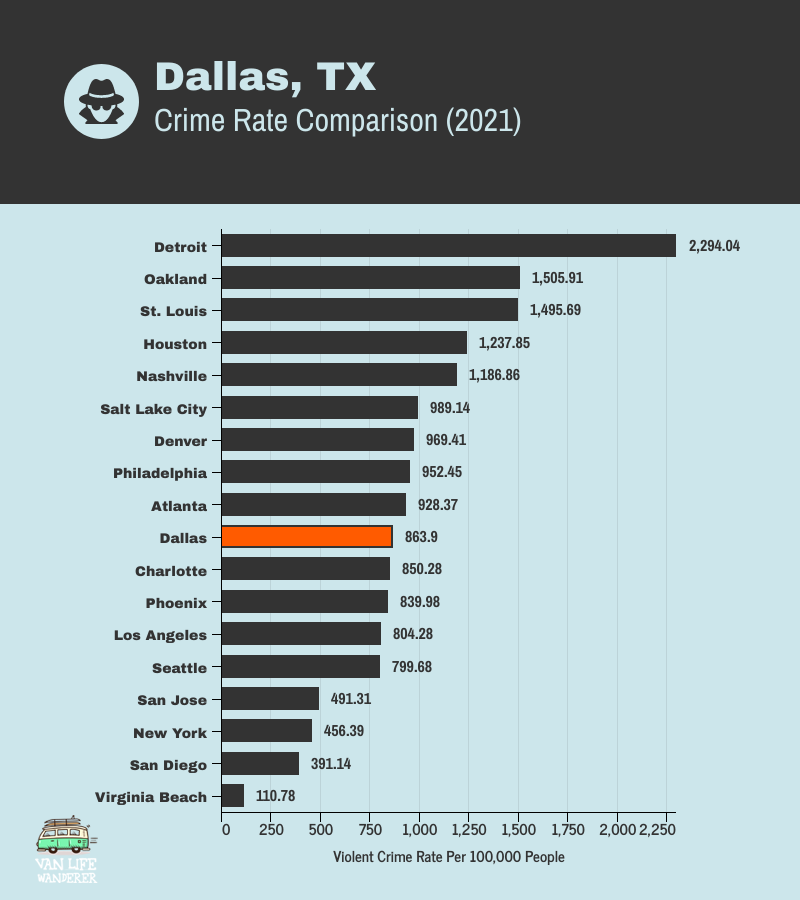
Statistically speaking, Dallas is a slightly unsafe place to visit. In 2021, Dallas had a violent crime rate of 863.90 incidents per 100,000 residents, which is more than twice the national average.
It’s property crime rate of 3,581.73 per 100,000 people is 1.8 times greater than the national average.
Here’s a chart to give you some perspective on Dallas’ crime rate compare to other major cities in the United States. Dallas’ crime rate is comparable to Charlotte and Phoenix.
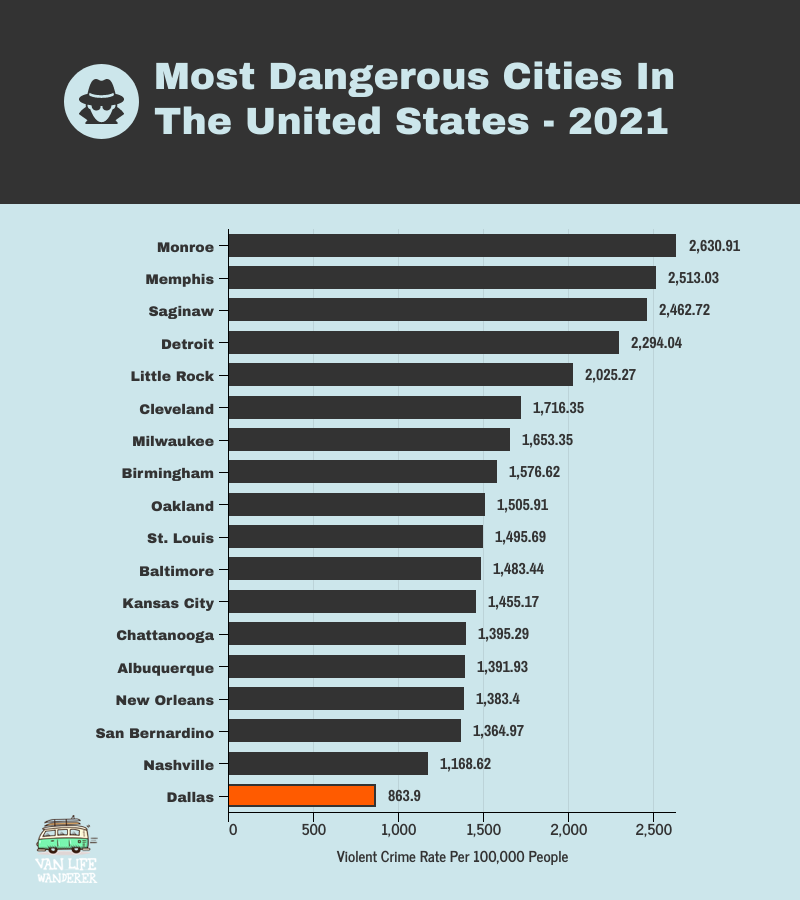
Here’s a chart to give you some perspective on how Dallas’ crime rate compares to the most dangerous cities in the United States:
Dallas Crime Rates
Violent Crime Rate
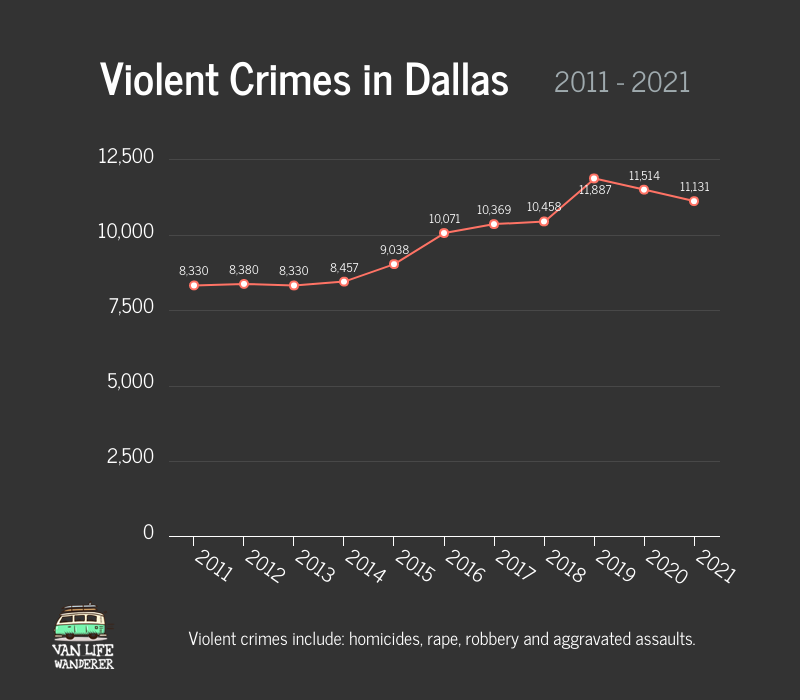
In 2021 Dallas reported 11,131 violent crimes and had a violent crime rate of 863.90 per 100,000 people.
Year over year violent crime has decreased by 3%.
You have a 1 in 116 chance of becoming a victim of violent crime in Dallas.
Here’s a graph showing you how violent crime has trended in Dallas over a 12 year period.
Murder Rate
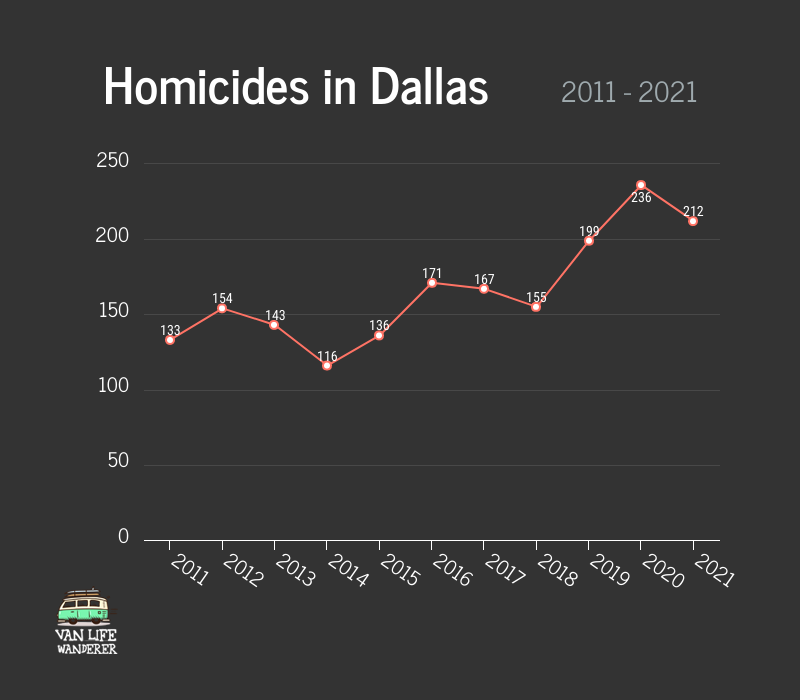
In 2021, Dallas reported 212 murders and had a murder rate of 16.45 per 100,000 people.Dallas’ murder rate is 2.5 times higher than the national average.
Year over year murder has decreased by 10%.
You have a 1 in 6,078 chance of becoming a victim of murder in Dallas.
Here’s a graph showing you how murders has trended in Dallas over a 12 year period.
Property Crime Rate
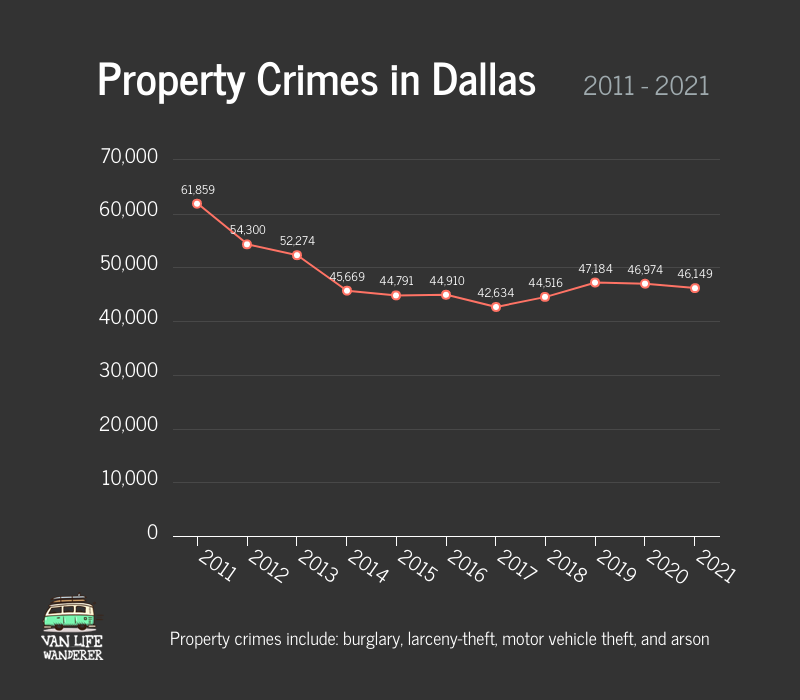
In 2021 Dallas reported 46,149 property crimes and had a property crime rate of 3,581.73 per 100,000 people.
Year over year property crime in Dallas has decreased by 2%.
You have a 1 in 28 chance of becoming a victim of property crime in Dallas.
Here’s a graph showing you how property crime has trended in Dallas over a 12 year period.
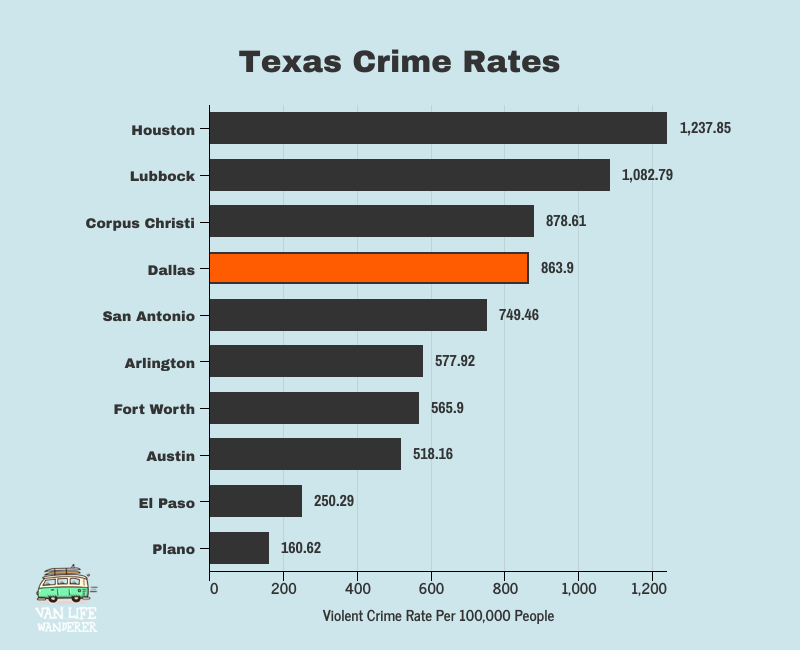
Dallas’ Crime Rate vs The Rest Of Texas
Looking at the chart below, you can see that in terms of violent crime, Dallas ranks 4th highest crime rate among the most populous cities in Texas.
Dallas Crime Stats
Here’s a breakdown of all the crimes in the city for 2021 compared with 2020:
Violet Crime In Dallas Is Concentrated In A Few Small Areas
Violent crime in Dallas is geographically concentrated in a small number of areas within Dallas. Researchers who analyzed a year of violent crime in the city found that 5.9% of the grids* accounted for all reported violent street crime in Dallas in 2020.
Historically, beats 318 in the Southeast Division , 454 in the Southwest Division, 744, and 731 in the South Central Division have consistently ranked as the most violence-prone areas in Dallas.
*Dallas PD’s seven patrol divisions are divided into 225 beats. Beats are further broken down into 1,156 small reporting areas and even smaller 330’ x 330’ grid square.
Is Downtown Dallas safe?
Downtown Dallas is a generally safe area to visit. If there is a special event, it’ll be pretty busy around the venue but for the most part it is pretty deserted at night.There is a homeless problem in certain areas but they are harmless for the most part.
Uptown is going to be more lively at night, and safer to walk around as well
Here’s what some residents have to say about Downtown:
A good rule of thumb for downtown at night is to stay within the region bounded by Commerce to the South and of course avoid the West End as it can get sketchy sometimes. If you know how to deal with the homeless and they don’t bother you, then the whole area is just as safe as any other downtown metro.
There are some cool things to do downtown, but for the most part, it’s kind of a dead zone for social activities.
Downtown is fine but don’t really venture into the Fair Park area, it is not a safe place. Deep Ellum is ok too, but they have had their issues in that neighborhood.
Downtown Dallas has a lot of homeless walking around but they are mostly harmless and Uptown is a clean place with lots of options for walking.
There’s not much going on in downtown at night, it’s kind of dead. Some of the homeless can be pushy and aggressive. I would stick to Uptown/Victory park, Knox-Henderson, Deep Ellum areas
Downtown Dallas is business center so there are not a ton of people out at night.
Deep Elum thru Uptown and through Oak Lawn, you should be fine
What do residents of Dallas say about its safety
Much of the crime in Dallas is pretty specific to the perpetrator and the victim. Avoid gangs, avoid drugs, avoid drug deals with people in gangs, and don’t buy drugs on the street. That gets you pretty far in terms of staying safe.Stay away from South Dallas.
South Dallas is a sh*t hole, East Dallas is quickly heading in the same direction. Anything in North Dallas is rich people territory, anything west of Dallas is the middle class.
Avoid South Garland and South Dallas and the area around Park Lane off of 635.
The thing about Dallas is that it is very spotty. One neighborhood can be fine, and the neighborhood one block over can have issues.
Walking through downtown or Deep Ellum at night you will get approached by a LOT of homeless asking for money, day or night. If you’re a woman I wouldn’t recommend downtown or Deep Ellum by yourself at night.
Pleasant Grove should be avoided. I wouldn’t even want to be in the area during the day.
I made the mistake of moving to Oak Cliff when I moved to Dallas. I heard rapid fire gun shots at least 3 times a week and sometimes daily.
The neighborhoods east and south of Fair Park have a fair amount of homeless and crime.
My husband is with Dallas Police. Do NOT go South of I-30. That is bad, ESPECIALLY Fair Park area. Downtown area is fine, but don’t go south of I-30 whatever you do. Stay north of 30 and the worse that’ll happen is your car may get broken into.
As one who has spent a lot of time in an ambulance in the Oak Cliff area I would say that there is always a great deal of police activity. Just saying.
The only part of North Dallas you should be alert of is North-West Dallas, North-East Dallas and Midtown and Springvalley Road…if you aren’t in those areas you are okay. Far North Dallas takes you into the suburbs.
I have lived in Oak Cliff for over two decades and I can say that area is not a great place. Most areas east of 35 and south of 30 are going to be sketchy.
In my many years of of living in Dallas, I would say it is a pretty safe city. Even the most dangerous parts of Dallas are nothing compared to areas like Detroit, Chicago, St Louis, Milwaukee, or Oakland.
Is Dallas safe at night?
Like any large city, there are areas where you shouldn’t think of going at night, namely Fair Park, Oak Cliff, and Pleasant Grove and most of South Dallas and North West Dallas. These are the most dangerous areas and even long time residents have qualms about going there.
Is it safe to visit alone?
Dallas can be a safe place to travel alone as long as you know which areas to avoid. Dallas is a BIG city, and there arerisks involved when you’re in a big town by yourself. As well as being more of a targetfor petty theft.
Research the areas in Dallas that you want to visit and Use Google Maps street view to see if the areas are sketchy.
Dallas Safety Tips
Stay where the streets are well lit and where there’s more foot traffic and plan your routes ahead of time and don’t take shortcuts.
Always be aware of your surrounding. Don’t wear headphones and don’t get lost in your phone.
Restrict your sight seeing for the day time.
Make sure your car is filled with gas. You don’t want to end up in a sketchy part of town, in the middle of the night.
Don’t wear anything flashy or fancy. Doing so will only make you a target.
Educate yourself with the layout of the city. Understand which areas you should and shouldn’t go to.
Don’t overdo it with alcohol. You want to have all your mental faculties in place when in a new area.
Don’t leave valuables in your car or in plain sight in your car.
If you turn down one of a streets and it seems sketchy AF don’t go down there.
Don’t walk around alone at night. Take an Uber or get a taxi.
Final Thoughts
For the most part Dallas is a moderately safe place to visit. The crime stats are not staggering and most residents agree that Dallas is pretty safe with exception to certain areas which include; South Dallas, Fair Park, Oak Cliff, Pleasant Grove and parts of East Dallas, North West Dallas and North-East Dallas. Something else to keep in mind is that most violent crime in the city is concentrated in only several parts of the city.
")
")
")
")
")
")
")
")
")
Leave a Reply