Lets deep dive into the some statistics, look at crime rates and graphs and see how safe or dangerous Los Angeles really is.
What is Los Angeles’ Crime Rate?
In 2021 Los Angeles reported 30,078 violent crimes and had a crime rate of 804.28 per 100,000 residents. Los Angeles’s crime rate is 2 times higher than the national average and is on par with cities like Dallas, Phoenix and Atlanta.
Population
Violent Crime
Los Angeles’s Crime Rate
2017
3,952,002
30,507
771.94
2018
3,960,456
30,126
760.67
2019
3,967,323
28,939
729.43
2020
3,898,747
28,359
727.39
2021
3,739,740
30,078
804.28
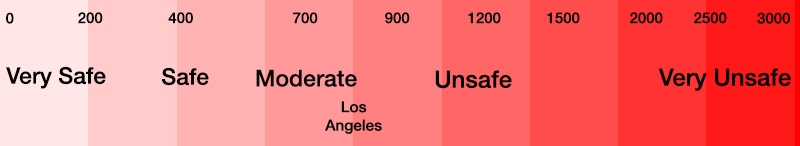
Here’s a scale to give you some perspective on Los Angeles’s violent crime rate:
Los Angeles does have an elevated crime rate. It’s crime rate is significantly higher than the national average, but still below the level of an ‘unsafe’ city.
Los Angeles’ Crime Rate Breakdown
Violent Crime Rate
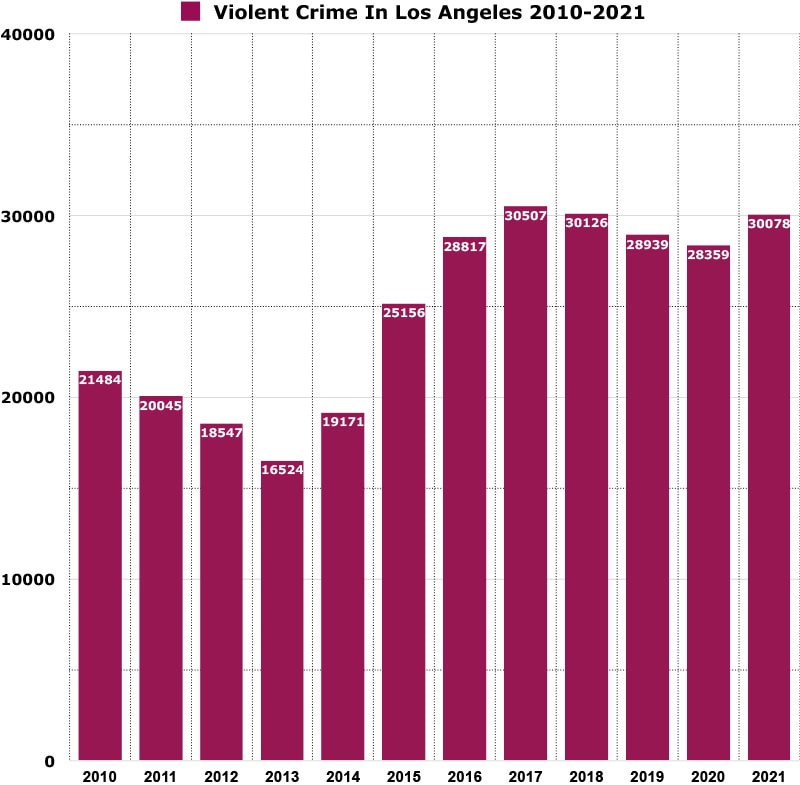
Year over year violent crime has increased by 6%.
You have a 1 in 124 chance of becoming a victim of violent crime in Los Angeles.
Here’s a graph showing you how violent crime has trended in Los Angeles over a 12 year period. Violent crime was at its lowest level in 2013 and has almost doubled since then.
*Violent crimes include; homicides, rape, robbery and aggravated assaults.
Murder Rate
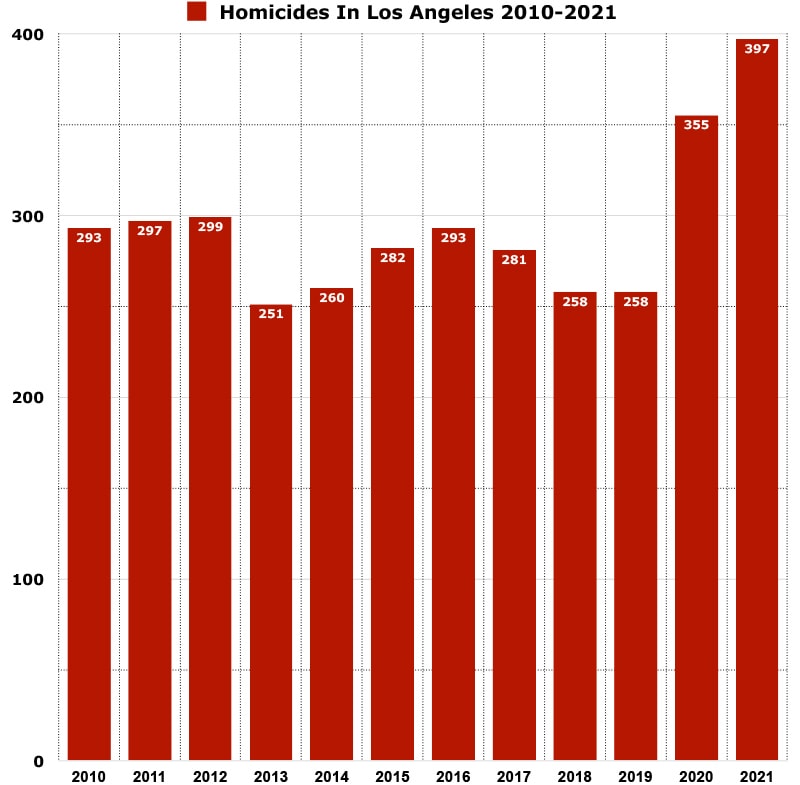
In 2021, Los Angeles reported 397 murders and had a murder rate of 10.62 per 100,000 residents.
Los Angeles’ murder rate is 1.6 times greater than the national average.
You have a 1 in 9,420 chance of becoming a victim of murder in Los Angeles.
Here’s a graph showing you how murders have trended over the last 12 years in Los Angeles. Murders have increased nearly 60% since 2019
Here’s a table you showing the murder rates of 14 major cities in the United States. Los Angeles has the 9th highest murder rate and is comparable to cities like Portland, Phoenix and Las Vegas.
Murder Rate
1. Philadelphia
35.4
2. Washington D.C.
32.2
3. Chicago
29.3
4. Oakland
28.6
5. Houston
20.3
6. Dallas
16.1
7. Phoenix
11.5
8. Portland
11
9. Los Angeles
10.6
10. Las Vegas
8.7
11. San Francisco
6.3
12. New York
5.7
13. San Diego
4.1
14. San Jose
2.9
Property Crime Rate
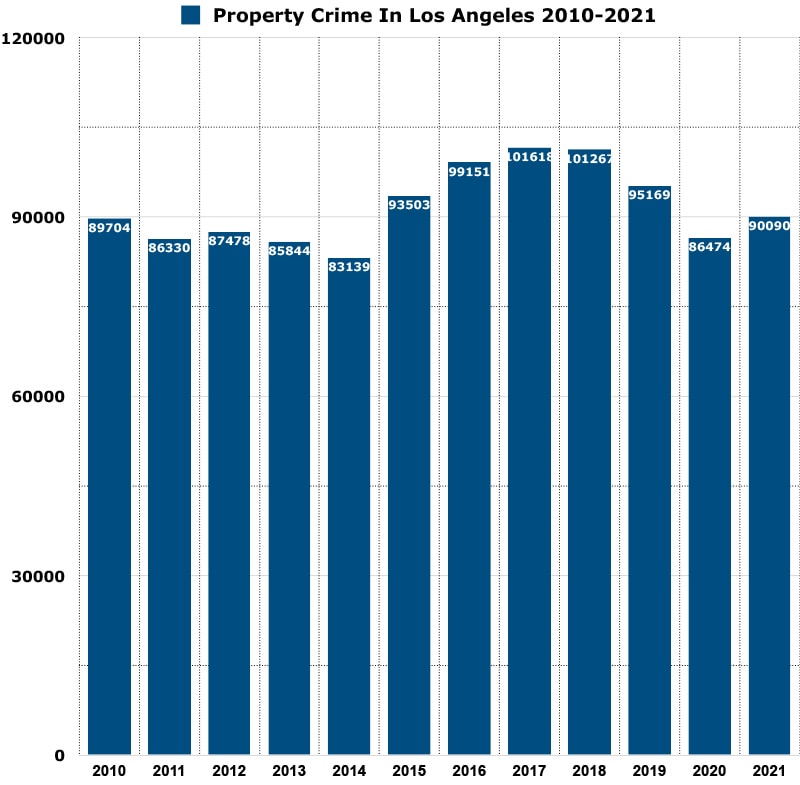
In 2021 Los Angeles reported 90,090 property crimes and had a property crime rate of 2,408.99 per 100,000 residents.
Los Angeles’s property crime rate is 1.2 times greater the national average.
Year over year property crime has increased by 4%.
You have a 1 in 42 chance of becoming a victim of property crime in Los Angeles.
Here’s a graph showing you how property crime has trended in Los Angeles over a 12 year period.
*Property crimes include; burglary, larceny-theft, motor vehicle theft, and arson
Los Angeles’s crime rate vs other cities in California (2020)
Here’e how Los Angeles’s violent crime rate compared to other cities in California. Los Angeles had the highest crime rate of all the most populous cities in California.
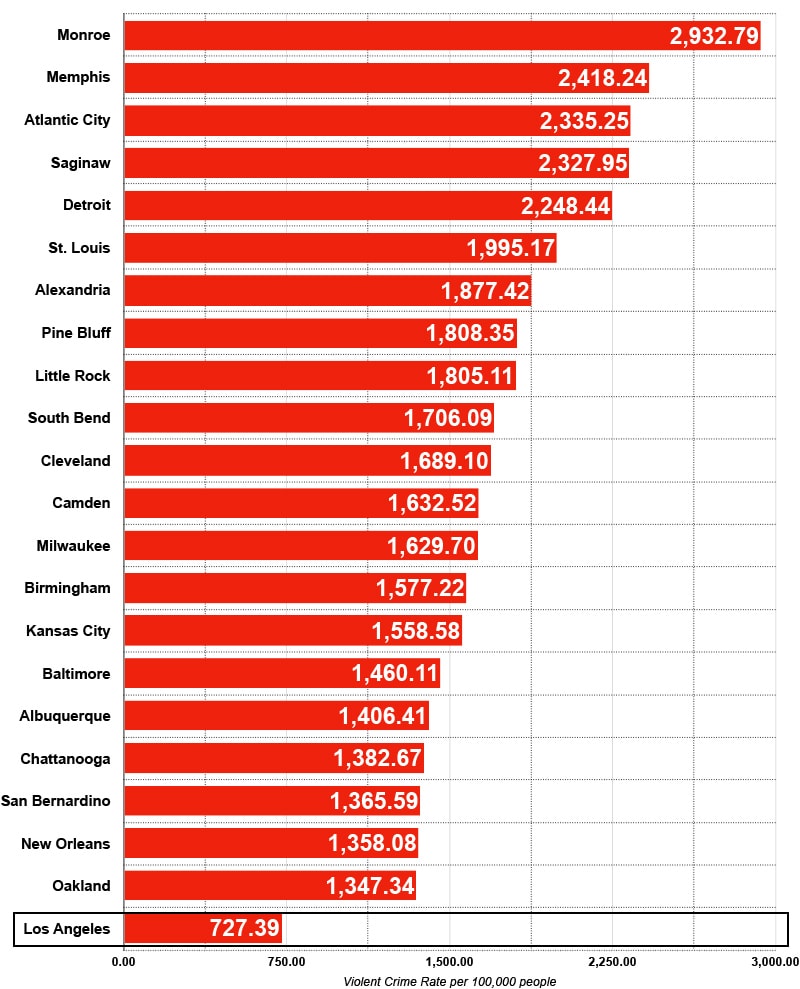
Here’s a list of the top 22 most dangerous cities in the United States ranked by crime rates. Los Angeles’s crime rate is 3.7x less than Monroe, the most dangerous city in the U.S.
How are Los Angeles’ crime rates calculated?
Crime rate is calculated by dividing the number of reported crimes by the total population; the result is multiplied by 100,000.
For example, in 2021 there were 397 murders in Los Angeles and the population was 3,739,740. This equals a murder rate of 10.62 per 100,000 residents.
How much has crime increased in Los Angeles?
In 2021, Los Angeles reported 120,168 total crimes, which is a 4.6% increase over 2020.
In 2021, Los Angeles reported 30,078 violent crimes, which is a 6% increase over 2020.
In 2021, Los Angeles reported 397 murders, which is a 12% increase over 2020.
In 2021, Los Angeles reported 90,090 property crimes, which is a 4.2% increase over 2020.
Is Los Angeles safe?
Statistically speaking, Los Angeles is a slightly unsafe city. It’s violent crime rate of 804.28 per 100,000 residents and its murder rate of 10.62 per 100,000 residents is significantly higher than the national average.
Facts about Los Angeles, CA
The population of Los Angeles in 2021 is 3,739,740 and is the 2nd most populous city in the United States.
The city covers a land area of 469.49 square miles.
The median age of the city is 34.1 years old.
The median income for a household in the city was $65,290. The per capita income for the city was $65,290.
16.9% of the population live below the poverty line.
78.3% of residents 25 and older is a high school graduate. 35.6% of residents 25 and older has a bachelors degree or higher.
The median home price in Los Angeles is $950,000 in 2022.
In 2022, the average rent for a Los Angeles 2-bedroom apartment is $2,995.
")
")
")
")
")
")
")
")
")
Leave a Reply