Lets deep dive into the some statistics, look at crime rates and graphs and see how safe or dangerous San Jose really is.
What is San Jose’s Crime Rate?
In 2021 San Jose had a crime rate of 478.27 per 100,000 residents. San Jose’s crime rate is 20% greater than the national average and is on par with cities like San Diego, Austin and New York.
Here’s a table showing you San Jose’s crime rate over the past 5 years.
Population
Violent Crime
San Jose’s Crime Rate
2017
1,032,136
4,188
405.76
2018
1,030,119
4,444
431.41
2019
1,021,795
4,559
446.18
2020
1,013,240
4,375
431.78
2021
1,010,302
4,832
478.27
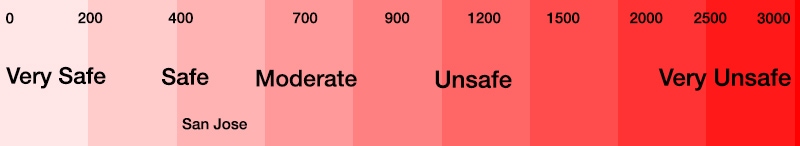
Here’s a scale to give you some perspective on San Jose’s violent crime rate:
Does San Jose have a high crime rate?
San Jose does not have a high crime rate. It’s crime rate is one of the lowest in the nation for a city of its size.
San Jose’s Crime Rate Breakdown
Violent Crime Rate
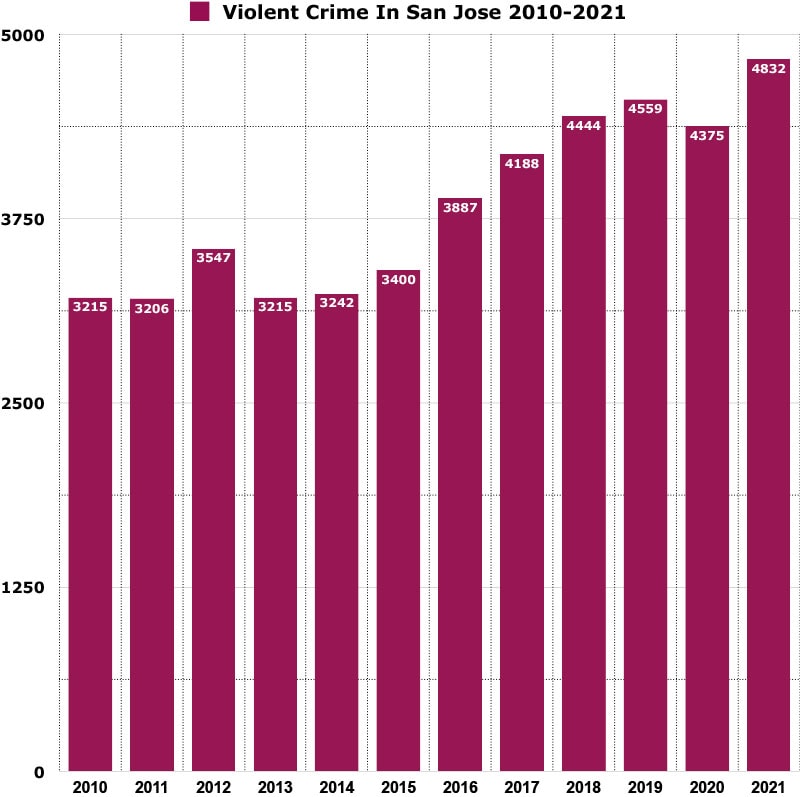
In 2021, San Jose reported 4,832 violent crimes and had a violent crime rate of 478.27 per 100,000 residents. Violent crimes include; homicides, rape, robbery and aggravated assaults.
Year over year violent crime has increased by 10.46%.
You have a 1 in 209 chance of becoming a victim of violent crime in San Jose.
Here’s a graph showing you how violent crime has trended in San Jose over a 12 year period. Violent crime was at its lowest level in 2011 and has increased nearly 50% since then.
Murder Rate
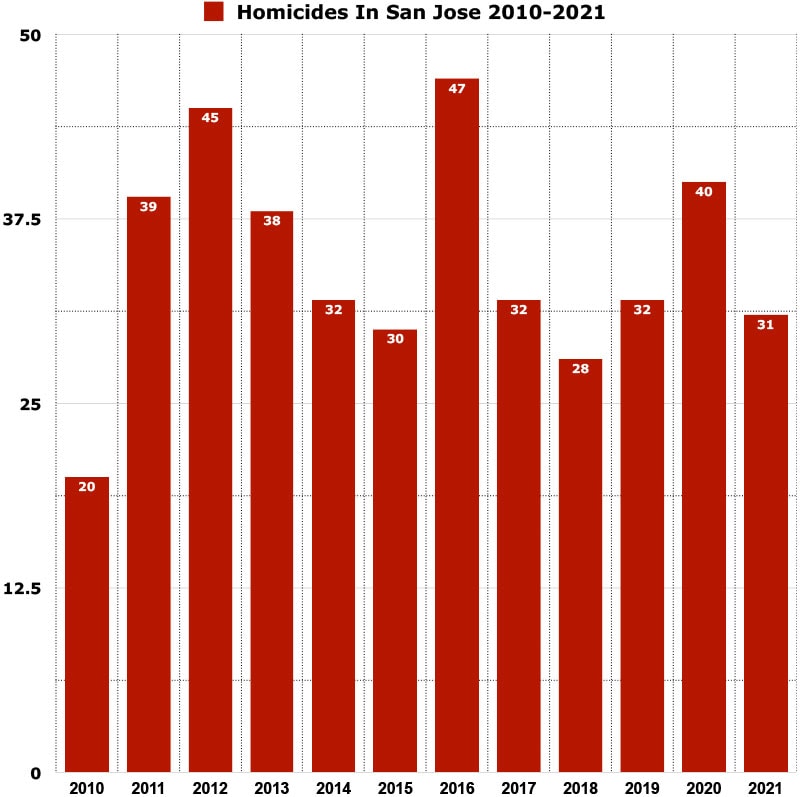
In 2021, San Jose reported 31 murders and had a murder rate of 3.07 per 100,000 residents. San Jose’s murder rate is 53% less than the national average.
Year over year murders has decreased 22.5%.
You have a 1 in 32,590 chance of becoming a victim of murder in San Jose.
Here’s a graph showing you how murders have trended over the last 12 years in San Jose.
Here’s a table you showing the murder rates of 15 major cities in the United States. San Jose murder rate and is comparable to cities like Philadelphia and Washington D.C.
Murder Rate
Philadelphia
35.4
Milwaukee
33.53
Washington D.C.
32.2
Chicago
29.3
Oakland
28.6
Houston
20.3
Dallas
16.1
Phoenix
11.5
Portland
11
Los Angeles
10.6
Las Vegas
8.7
Austin
8.5
San Francisco
6.3
New York
5.7
San Diego
4.1
San Jose
3.1
Property Crime Rate
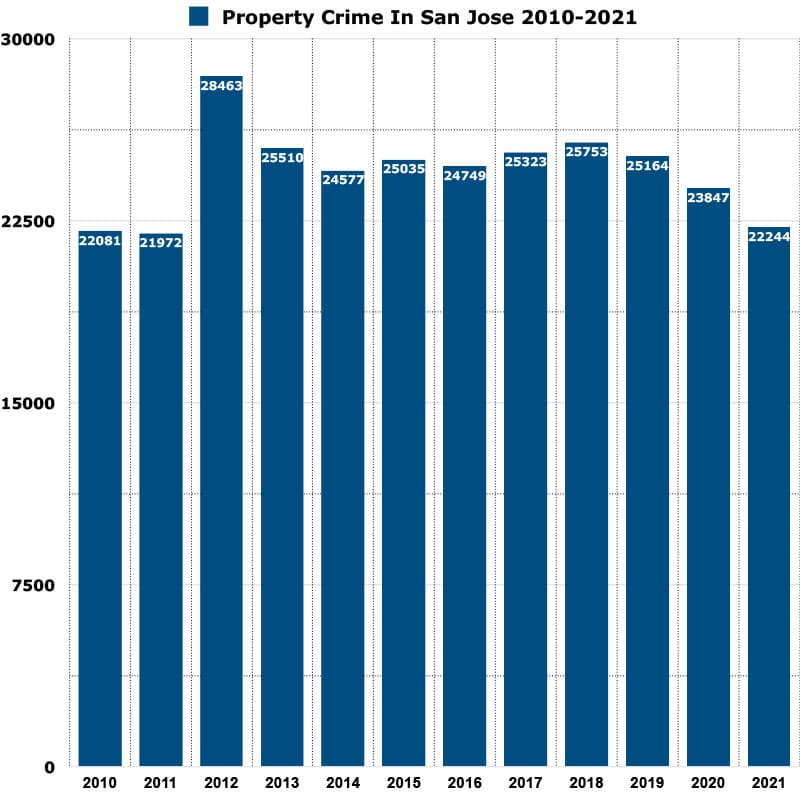
In 2021 San Jose reported 22,244 property crimes and had a property crime rate of 2,201.72 per 100,000 residents. San Jose’s property crime rate is 12% greater the national average. Property crimes include; burglary, larceny-theft, motor vehicle theft, and arson.
Year over year property crime has decreased by 6.72%.
You have a 1 in 45 chance of becoming a victim of property crime in San Jose.
Here’s a graph showing you how property crime has trended in San Jose over a 12 year period.
San Jose’s crime rate vs other cities in California (2020)
Here’s how San Jose’s crime rate compared to other cities in California. San Jose had one of the lowest crime rates of all cities listed.
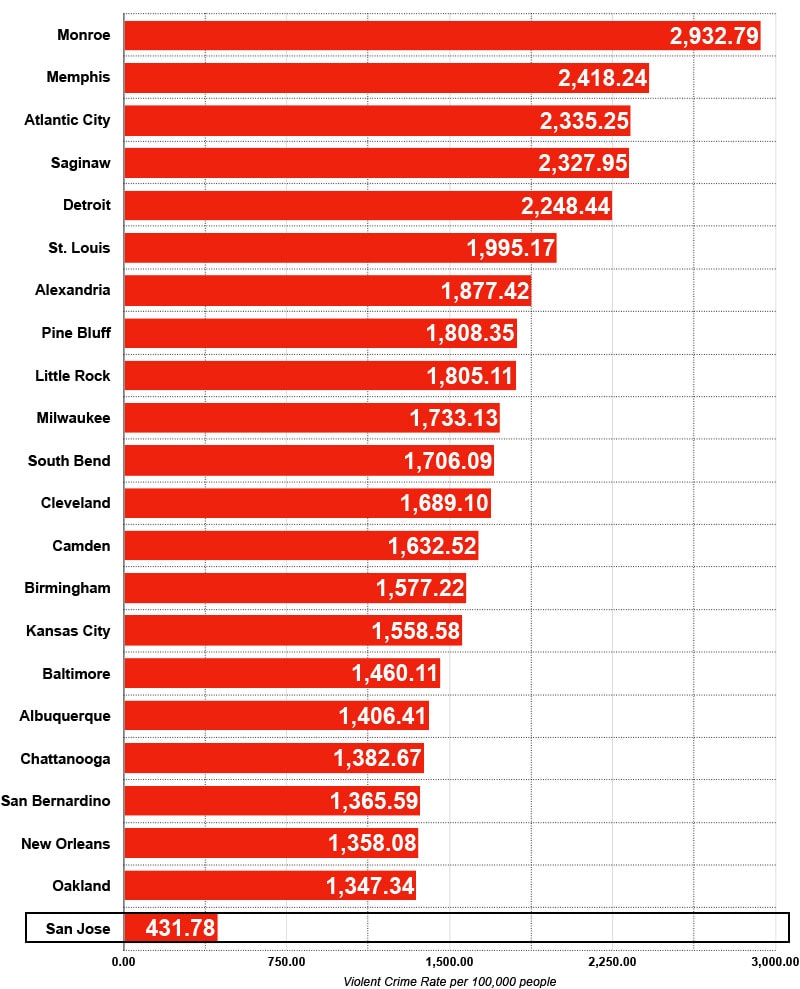
Here’s a list of the top 22 most dangerous cities in the United States ranked by crime rates. San Jose’s crime rate is 6 times less than Monroe, the most dangerous city in the U.S.
How are San Jose’s crime rates calculated?
Crime rate is calculated by dividing the number of reported crimes by the total population; the result is multiplied by 100,000.
For example, in 2021 there were 31 murders in San Jose and the population was 1,010,302. This equals a murder rate of 3.07 per 100,000 residents.
")
")
")
")
")
")
")
")
")
Leave a Reply