Located just 45 minutes north of San Diego, Oceanside is a charming beach town that flies under the radar of most travelers. In the last 10 years the city has undergone a radical transformation that has infused the city with a vibrance that is has never seen before.
If you are thinking about visiting Oceanside and have qualms about the safety of the city, we got you covered. We deep dived into the statistics, crime rates and talked to the residents of the city to give you a better understanding of how safe the safe the city really is.
Is Oceanside, CA safe?
Statistically speaking, Oceanside is a safe city as indicated by its crime rates. In 2021, Oceanside had a violent crime rate of 444.55 per 100,000 residents, which is 12% higher than the national average. Oceanside’s crime rate is similar to cities like cities like Anaheim, San Diego and Austin.
Here’s a scale to give you some perspective on Oceanside’s crime rate

Oceanside Crime Rates And Crime Stats
The most recent, complete set of crime statistics comes from the FBI UCR and cross referenced with the Oceanside PD and are for 2020 and 2021:
Oceanside police reported a total of 4,143 offenses in 2021, compared with 3,946 in 2020, which is a 5 percent year-over-year increase.
|
CRIME REPORTS |
2020 |
2021 |
Percentage Change |
|
Homicide |
4 |
6 |
50% |
|
Rape |
73 |
83 |
14% |
|
Robbery |
139 |
163 |
17% |
|
Aggravated Assault |
501 |
517 |
3% |
|
VIOLENT CRIME TOTAL |
717 |
769 |
7% |
|
Burglary |
426 |
426 |
0% |
|
Larceny/Theft |
2,336 |
2,422 |
4% |
|
Auto Theft |
419 |
486 |
16% |
|
Arson |
48 |
40 |
-17% |
|
PROPERTY CRIMES TOTAL |
3,229 |
3,374 |
4% |
|
CRIME TOTALS |
3,946 |
4,143 |
5% |
Violent Crime Rate
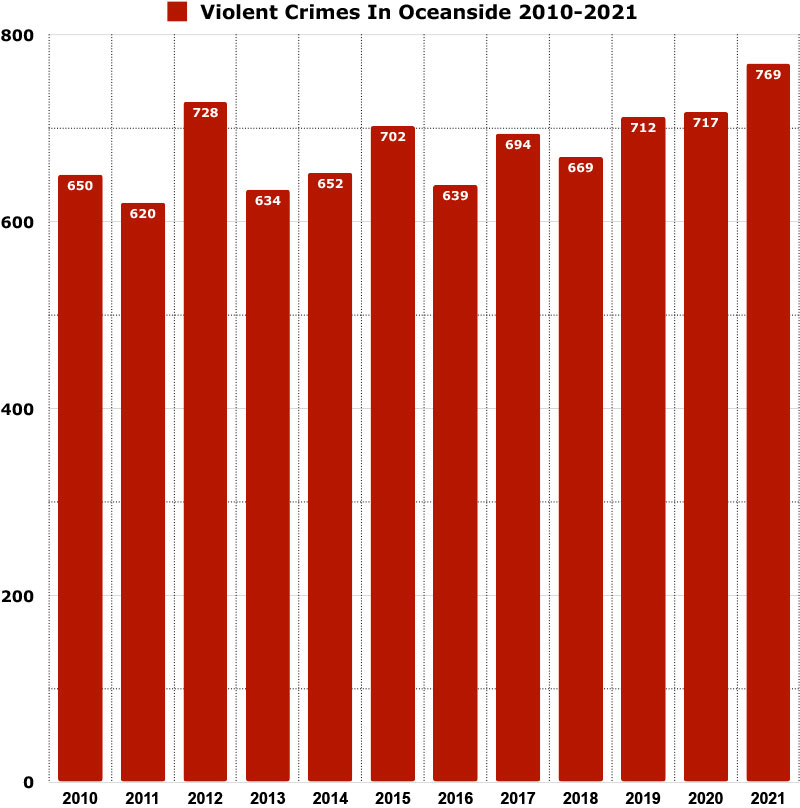
In 2021 Oceanside reported 769 violent crimes and had a violent crime rate of 444.55 per 100,000 residents. Oceanside’s violent crime rate is 12% higher than the national average.
Year over year violent crime increased 7%.
You have a 1 in 225 chance of becoming a victim of violent crime in Oceanside.
Violent crimes include; homicides, rape, robbery and aggravated assaults.
Here’s a graph showing you how violent crime has trended in Oceanside in the last 12 years.
Property Crime Rate
In 2021 Oceanside reported 3,374 property crimes and had a property crime rate of 1,950.49 per 100,000 residents. Oceanside’s property crime rate is on par with the national average.
Year over year property crime increased 4%.
You have a 1 in 51 chance of becoming a victim of property crime in Oceanside.
Property crimes include; burglary, larceny-theft, motor vehicle theft, and arson.
Murder Rate
In 2021 Oceanside reported 6 murders and had a murder rate of 3.47 per 100,000 residents. Oceanside murder rate is 46% less than the national average.
You have a 1 in 28,830 chance of becoming a victim of murder in Oceanside.
Oceanside Crime Map
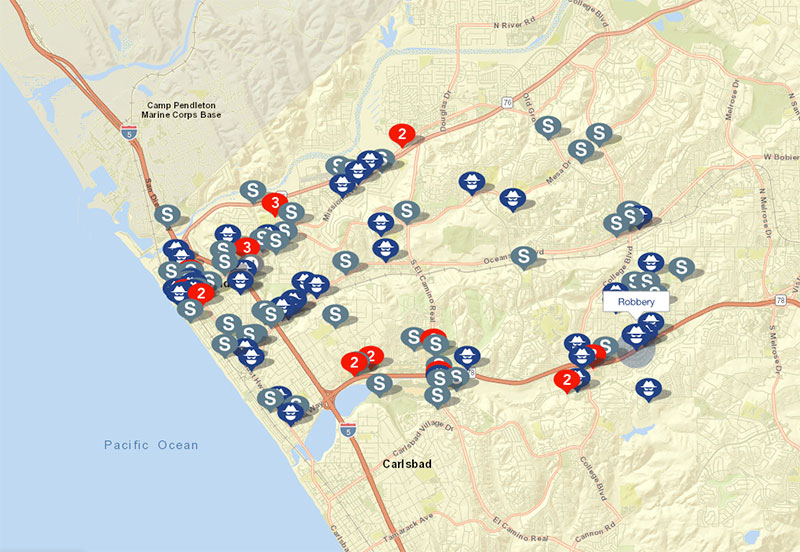
Here’s a map showing you all the locations of violent crime (homicides, robberies and sexual assaults) in Oceanside from 1/1/2022 – 6/15/2022 via CrimeMapping
Oceanside’s crime rate vs other cities in California (2020)
Here’s how Oceanside’s crime rate compared to other cities in California. Oceanside had a similar crime rate to Bakersfield and San Jose.
|
|
Population |
Violent Crime Rate |
|
440,646 |
1,347.34 |
|
|
320,804 |
1,254.04 |
|
|
3,898,747 |
727.39 |
|
|
524,943 |
675.69 |
|
|
542,107 |
656.70 |
|
|
873,965 |
556.89 |
|
|
466,742 |
501.99 |
|
|
403,455 |
497.45 |
|
| Oceanside | 172,982 |
444.55 |
|
1,013,240 |
431.78 |
|
|
1,386,932 |
382.35 |
|
|
346,824 |
357.82 |
Oceanside’s Crime Rate Comparison
Here’s a list of the top 23 most dangerous cities in the United States ranked by violent crime rates. Oceanside’s violent crime rate is 6 times less than Monroe, Louisiana, the most dangerous city on the list.
|
City |
Population |
Violent Crime Rate per 100,000 people |
|
Monroe |
47,702 |
2,932.79 |
|
Memphis |
633,104 |
2,418.24 |
|
Atlantic City |
38,497 |
2,335.25 |
|
Saginaw |
44,202 |
2,327.95 |
|
Detroit |
639,111 |
2,248.44 |
|
St. Louis |
301,578 |
1,995.17 |
|
Alexandria |
45,275 |
1,877.42 |
|
Pine Bluff |
41,253 |
1,808.35 |
|
Little Rock |
202,591 |
1,805.11 |
|
Milwaukee |
577,222 |
1,733.13 |
|
South Bend |
103,453 |
1,706.09 |
|
Cleveland |
372,624 |
1,689.10 |
|
Camden |
71,791 |
1,632.52 |
|
Birmingham |
200,733 |
1,577.22 |
|
Kansas City |
508,090 |
1,558.58 |
|
Baltimore |
585,708 |
1,460.11 |
|
Albuquerque |
564,559 |
1,406.41 |
|
Chattanooga |
181,099 |
1,382.67 |
|
San Bernardino |
222,101 |
1,365.59 |
|
New Orleans |
383,997 |
1,358.08 |
|
Oakland |
440,646 |
1,347.34 |
| Oceanside | 172,982 | 444.55 |
Is Downtown Oceanside safe?
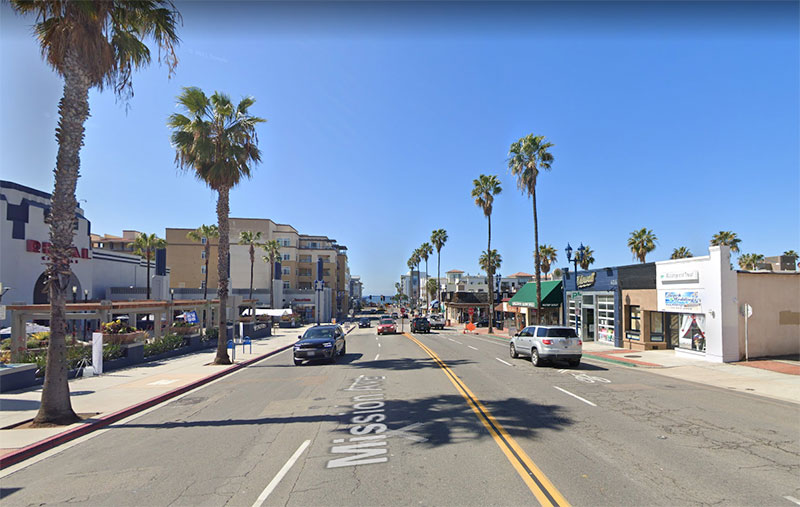
Downtown Oceanside is generally a safe area during the day and at night. There are a lot of good options for restaurants, bars and shopping, which are all in walking distance of each other and there is usually a good amount of people and police around.
The only thing you really have to be concerned about is some drunk idiot coming out of a bar and trying to start a fight.
Is the public transportation in Oceanside, CA safe?
The public transportation system in Oceanside is handled by the North County Transit, which offers many routes that interweave throughout the entire city.
The NCT is generally a safe option to use during normal commuting areas (6am – 7pm). Outside of those hours, we recommend that you take a taxi or use a ride sharing service to get around town.
Is Oceanside, CA safe at night?
Oceanside is generally a safe city at night. At night you should always stay in well populated areas and avoid walking through alleys or desolate areas. And as a woman you should also avoid walking far distance by yourself at night.
Is Oceanside safe for a solo traveler?
Oceanside is safe for all travelers, including female solo travelers!
If you visit Oceanside alone you’ll be plenty safe if you practice common sense when it comes to safety (i.e. avoid walking alone at night, locking up your vehicles, and keeping an eye on your things belongings).
What do residents of Oceanside say about it’s safety?
- Oceanside is pretty safe these days. They have done a good job of cleaning up the bad areas.
- Oceanside used to have a bad reputation when there was a lot more crime and the military recruits were being knuckleheads but it has become waaaaaay more clean and less crime ridden.
- The old reputation is no longer true. Oceanside is safe, clean an and a great place to live. There are lots of good restaurants and shops.
- Most Of Oside is pretty safe since it is a military town. There are some sketchy areas here and there but nothing prevalent.
- Oceanside is being gentrified right now. Tons of new business are opening up and there are lots of younger people with money moving in.
- I was born and raised here and I can confidently say it’s safe. There are some patches of problem areas, but overall it’s good! It’s a beach town so expect some homeless here and there.
- Oceanside from the 90s and today is completely different. 90s Oceanside was seedy, although I didn’t mind having the strip clubs around.
- Oceanside is not dangerous. I don’t fear for my safety when I’m out and about. As long as you keep your wits about you and use common sense, you should be fine.
- Don’t be in a gang, don’t deal drugs. Don’t engage in illicit activities and you should be good.
Tips to stay safe while visiting Oceanside, CA
- Always be aware of your surroundings. Always scan the area around you while walking.
- Stay in well populated and well-lit areas at night. Don’t walk through alleys and don’t walk through deserted blocks.
- Don’t leave anything of value in your car. Make your car as untempting as possible to thieves.
- Plan out your routes beforehand. Make sure you know how to get to your destination and make sure you know how to get back.
- Don’t engage with homeless people. Just avoid them and keep walking.
- Walk away from someone trying to start a fight, unless you have no other choice.
Facts about Oceanside, CA
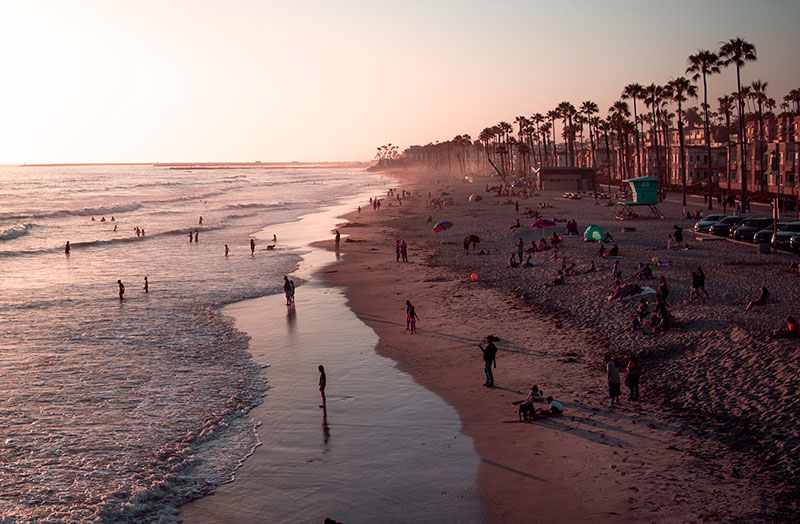
- The population of Oceanside in 2021 was 172,982 and is the 28th most populous city in California.
- The city covers a land area of 41.26 sq mi.
- The median age was 35.2 years.
- 87% of residents 25 and older is a high school graduate. 31.6% of residents 25 and older has a bachelors degree or higher.
- The median income for a household in the city was $75,411. The per capita income for the city was $34,768.
- 9.6% of the population live below the poverty line.
- The median home value in Oceanside is $850,000 in 2022.
- In 2022, the average rent for a Oceanside 2-bedroom apartment is $2,655.




Leave a Reply