To determine the safest cities in South Carolina, we compiled data from the FBI’s Uniform Crime Report and sorted each city’s violent crime rate. Violent crimes include: murder, rape, robbery and aggravated assaults.
Violent crime rate is calculated by dividing the total numbers of violent crime by the total population; the result is multiplied by 100,000.
The South Carolina state average for violent crime is 530.7 per 100,000 people and its state average for property crime is 2,721.1 per 100,000 people.
What Is The Safest City In South Carolina?
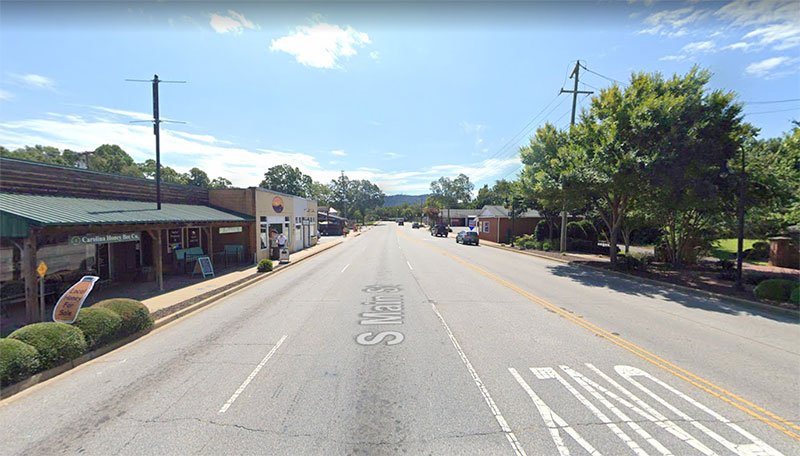
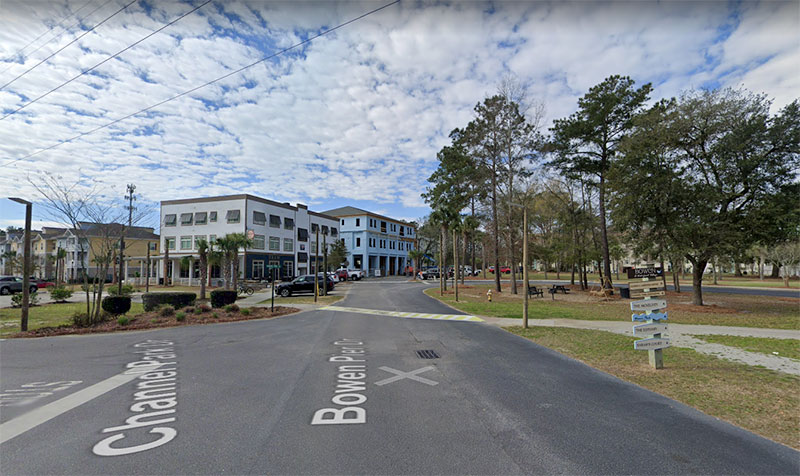
The safest city in South Carolina is Travelers Rest, a city that is located 15 minutes north west of Greenville. In 2020, Travelers Rest had a violent crime rate of 36.80 per 100,000 people. There was only 2 violent crime reported in the city in all of 2020, 1 aggravated assault and 1 robbery.
The 10 Safest Cities In South Carolina
|
|
Population |
Violent Crime Rate |
Property Crime Rate |
|
1. Travelers Rest |
5,435 |
36.80 |
3955.84 |
|
2. Tega Cay |
11,813 |
42.33 |
1938.54 |
|
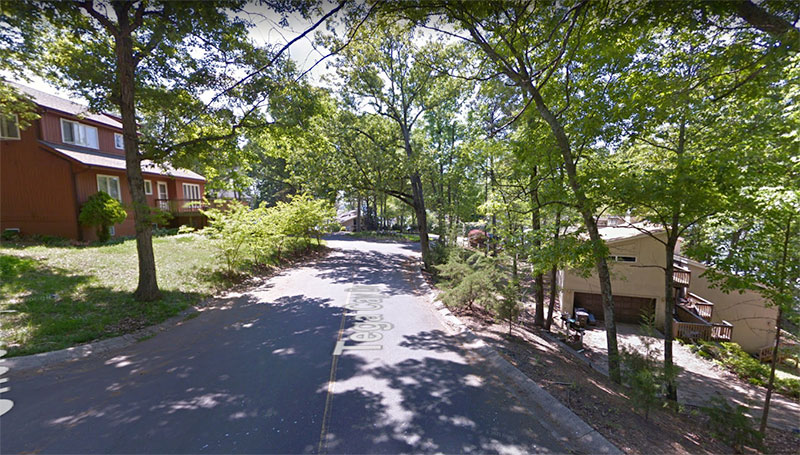
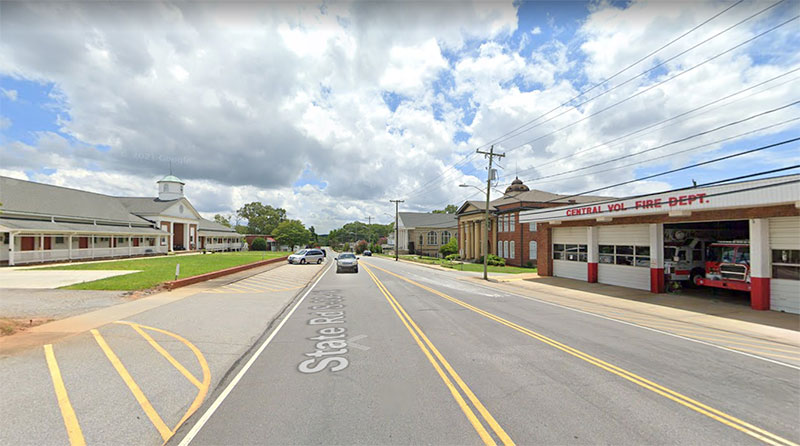
3. Central |
5,407 |
55.48 |
1978.92 |
|
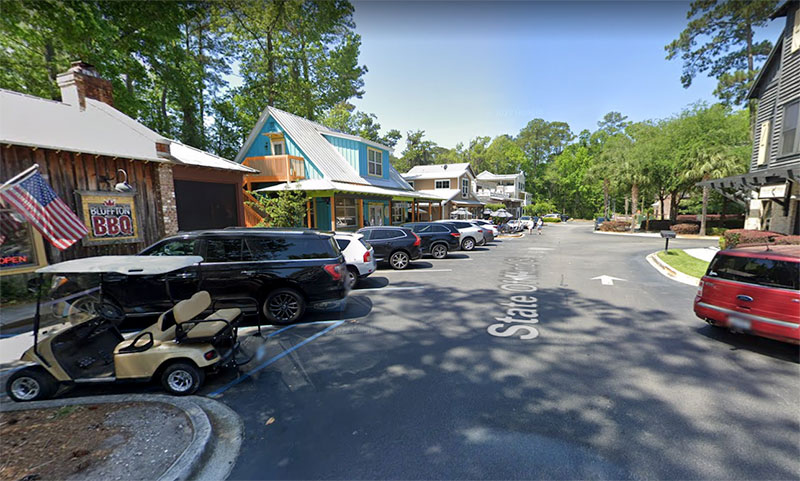
4. Bluffton |
27,549 |
72.60 |
722.35 |
|
5. Mount Pleasant |
94,704 |
91.87 |
1332.57 |
|
6. Fort Mill |
23,966 |
129.35 |
997.25 |
|
7. Clemson |
17,951 |
144.84 |
1999.89 |
|
8. North Augusta |
24,139 |
194.71 |
3028.29 |
|
9. Hanahan |
28,143 |
213.20 |
1179.69 |
|
10. Lexington |
22,592 |
221.32 |
2199.89 |
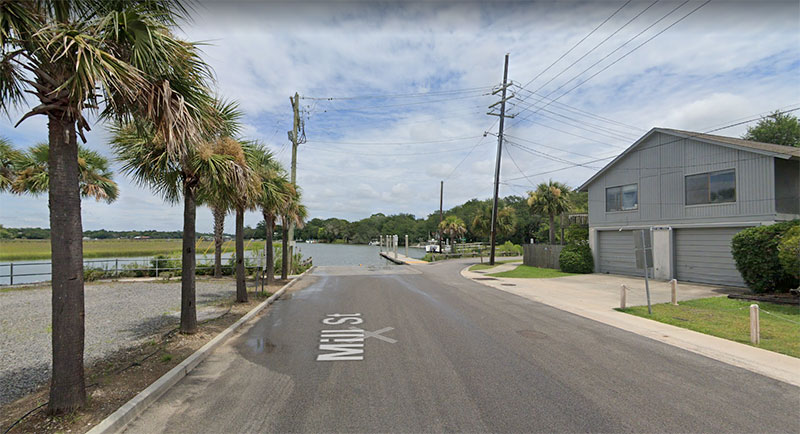
1.Travelers Rest – 36.80 violent crimes per 100k
(map)
| Population in 2020 | 5,435 |
| Property Crime Rate | 3955.84 |
| Median Household Income | $35,884 |
| Per Capita Income | $18,869 |
| Median Property Value | $330K |
2. Tega Cay – 42.33 violent crimes per 100k
(map)
| Population in 2020 | 11,813 |
| Property Crime Rate | 1938.54 |
| Median Household Income | $125,847 |
| Per Capita Income | $52,847 |
| Median Property Value | $473K |
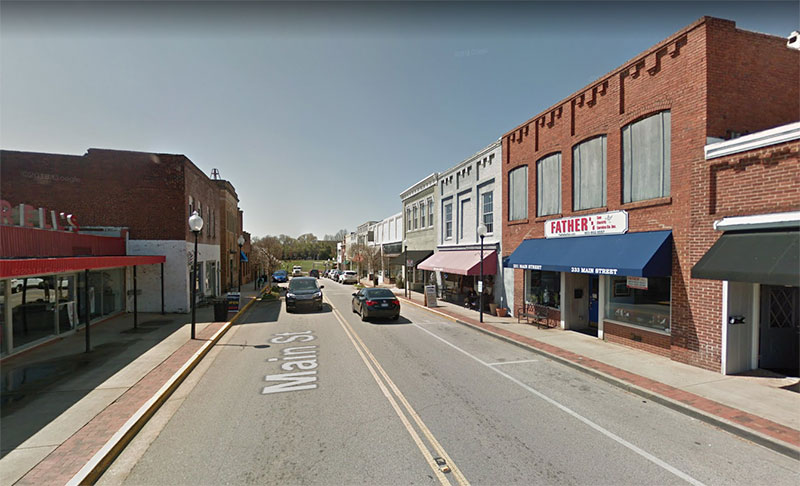
3. Central – 55.48 violent crimes per 100k
(map)
| Population in 2020 | 5,407 |
| Property Crime Rate | 1978.92 |
| Median Household Income | $31,233 |
| Per Capita Income | $16,977 |
| Median Property Value | $279K |
4. Bluffton – 72.60 violent crimes per 100k
(map)
| Population in 2020 | 27,549 |
| Property Crime Rate | 722.35 |
| Median Household Income | $85,844 |
| Per Capita Income | $44,326 |
| Median Property Value | $475K |
5. Mount Pleasant – 91.87 violent crimes per 100k
| Population in 2020 | 94,704 |
| Property Crime Rate | 1332.57 |
| Median Household Income | $104,772 |
| Per Capita Income | $58,409 |
| Median Property Value | $675K |
6. Fort Mill – 129.35 violent crimes per 100k
(map)
| Population in 2020 | 23,966 |
| Property Crime Rate | 997.25 |
| Median Household Income | $101,699 |
| Per Capita Income | $39,778 |
| Median Property Value | $467K |
7. Clemson– 144.84 violent crimes per 100k
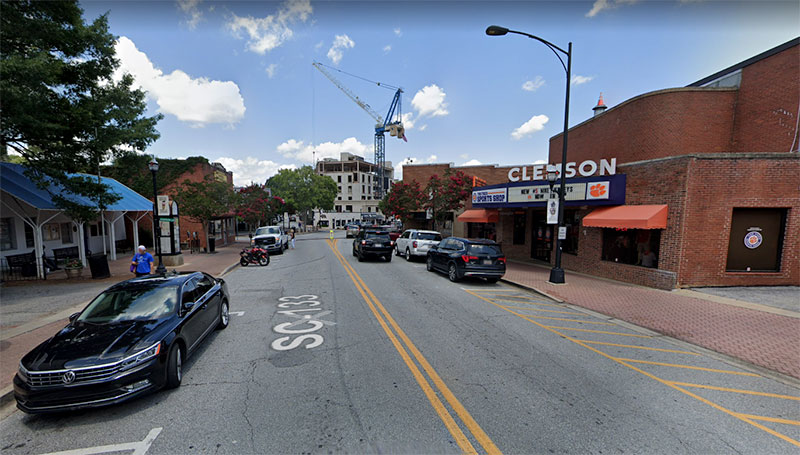
(map)
| Population in 2020 | 17,951 |
| Property Crime Rate | 1999.89 |
| Median Household Income | $46,075 |
| Per Capita Income | $32,106 |
| Median Property Value | $315K |
8. North Augusta– 194.71 violent crimes per 100k
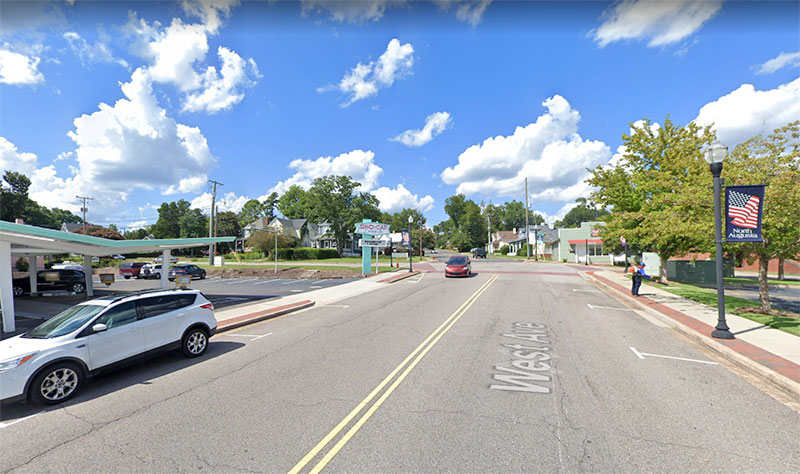
(map)
| Population in 2020 | 24,139 |
| Property Crime Rate | 3028.29 |
| Median Household Income | $63,795 |
| Per Capita Income | $35,886 |
| Median Property Value | $315K |
9. Hanahan – 213.20 violent crimes per 100k
(map)
| Population in 2020 | 28,143 |
| Property Crime Rate | 1179.69 |
| Median Household Income | $71,291 |
| Per Capita Income | $31,943 |
| Median Property Value | $367K |
10. Lexington – 221.32 violent crimes per 100k
(map)
| Population in 2020 | 22,592 |
| Property Crime Rate |
2199.89 |
| Median Household Income | $71,850 |
| Per Capita Income | $33,284 |
| Median Property Value | $281K |
Top 10 Safest Small-Sized Cities In South Carolina (0 – 10,000 People)
|
|
Population |
Violent Crime Rate |
Property Crime Rate |
|
1. Aynor |
1,025 |
0.00 |
975.61 |
|
2. Johnsonville |
1,484 |
0.00 |
808.63 |
|
3. Sullivans Island |
1,939 |
0.00 |
1753.48 |
|
4. Travelers Rest |
5,435 |
36.80 |
3955.84 |
|
5. Edgefield |
4,816 |
41.53 |
643.69 |
|
6. Central |
5,407 |
55.48 |
1978.92 |
|
7. Burnettown |
2,762 |
72.41 |
1339.61 |
|
8. Due West |
1,200 |
83.33 |
2333.33 |
|
9. Elgin |
1,616 |
123.76 |
4826.73 |
|
10. Isle of Palms |
4,385 |
136.83 |
1322.69 |
Top 10 Safest Medim-Sized Cities In South Carolina (10,000 – 50,000 People)
|
|
Population |
Violent Crime Rate |
Property Crime Rate |
|
1. Tega Cay |
11,813 |
42.33 |
1938.54 |
|
2. Bluffton |
27,549 |
72.60 |
722.35 |
|
3. Fort Mill |
23,966 |
129.35 |
997.25 |
|
4. Clemson |
17,951 |
144.84 |
1999.89 |
|
5. North Augusta |
24,139 |
194.71 |
3028.29 |
|
6. Hanahan |
28,143 |
213.20 |
1179.69 |
|
7. Lexington |
22,592 |
221.32 |
2199.89 |
|
8. Mauldin |
25,662 |
257.19 |
1944.51 |
|
9. Greer |
34,320 |
268.07 |
3126.46 |
|
10. Port Royal |
13,553 |
280.38 |
1527.34 |
Top 10 Safest Large Cities In South Carolina (50,000+ people)
|
|
Population |
Violent Crime Rate |
Property Crime Rate |
|
1. Mount Pleasant |
94,704 |
91.87 |
1332.57 |
|
2. Summerville |
53,711 |
359.33 |
2828.10 |
|
3. Greenville |
72,014 |
692.92 |
4188.07 |
|
4. Charleston |
139,582 |
464.96 |
2348.44 |
|
5. Columbia |
131,777 |
745.20 |
4597.16 |
|
6. North Charleston |
117,503 |
1149.76 |
5156.46 |
Related Posts:
")
")

")
")


")

Leave a Reply