If you are thinking about visiting El Cajon and have qualms about the safety of the city, we got you covered. We deep dived into the statistics, crime rates and talked to the residents of the city to give you a better understanding of how safe the safe the city really is.
Is El Cajon safe?
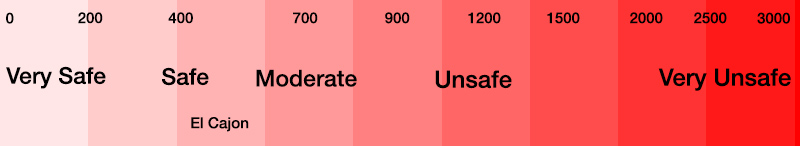
Although El Cajon has a spotty reputation among residents of San Diego County, if you just look at the statistics, El Cajon is a moderately safe city. In 2021, El Cajon had a violent crime rate of 496.05 per 100,000 residents, which is 24% higher than the national average. El Cajon’s crime rate is similar to Bakersfield, Long Beach and Riverside.
Here’s a scale to give you some perspective on El Cajon’s crime rate
El Cajon Crime Rates And Crime Stats
The most recent, complete set of crime statistics comes from the FBI UCR and cross referenced with the El Cajon Police Department and are for 2020 and 2021:
El Cajon police reported a total of 2,501 offenses in 2021, compared with 2,399 in 2020, which is a 4% year-over-year increase.
2020
2021
% Change
Homicide
5
2
-60%
Rape
33
42
27%
Robbery
113
113
0%
Aggravated Assaults
361
366
1%
VIOLENT CRIME TOTALS
512
523
2%
Burglary
288
358
24%
Larceny
1,203
1,176
-2%
Motor Vehicle Theft
355
418
18%
Arson
41
26
-37%
PROPERTY CRIME TOTALS
1,887
1,978
5%
TOTAL CRIME
2,399
2,501
4%
Violent Crime Rate
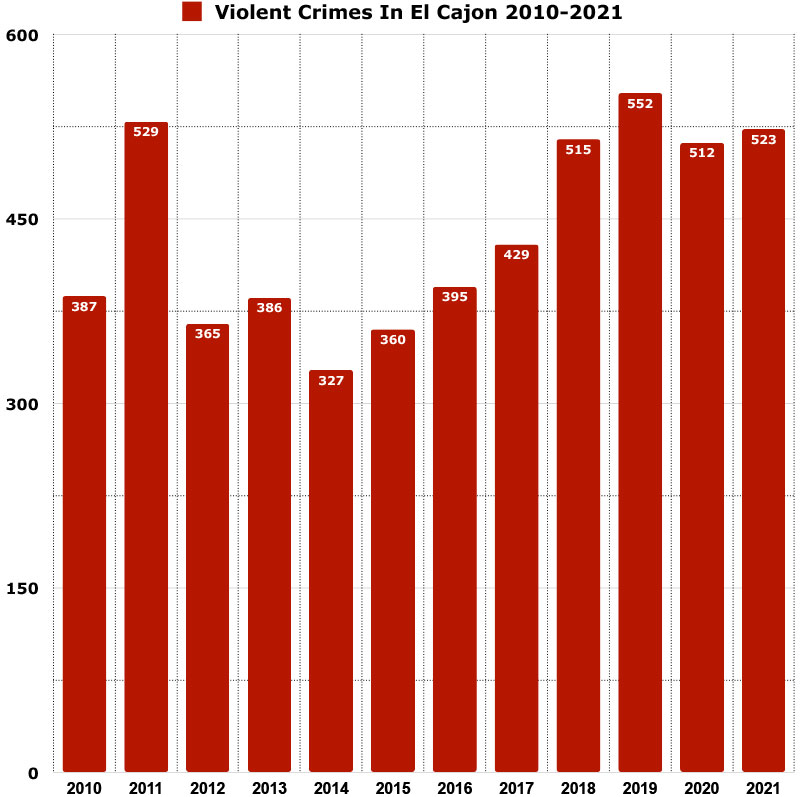
In 2021 El Cajon reported 523 violent crimes and had a violent crime rate of 496.05 per 100,000 residents. El Cajon’s violent crime rate is 24% higher than the national average.
Year over year violent crime increased 2%.
You have a 1 in 202 chance of becoming a victim of violent crime in El Cajon.
Violent crimes include; homicides, rape, robbery and aggravated assaults.
Here’s a graph showing you how violent crime has trended in El Cajon in the last 11 years.
Property Crime Rate
In 2021 El Cajon reported 1,978 property crimes and had a property crime rate of 1,876.09 per 100,000 residents. El Cajon’s property crime rate is 4% less than the national average.
Year over year property crime increased 5%.
You have a 1 in 53 chance of becoming a victim of property crime in El Cajon.
Property crimes include; burglary, larceny-theft, motor vehicle theft, and arson.
Murder Rate
In 2021 El Cajon reported 2 murders and had a murder rate of 1.9 per 100,000 residents. El Cajon’s murder rate is 71% less than the national average.
You have a 1 in 52,716 chance of becoming a victim of property crime in El Cajon.
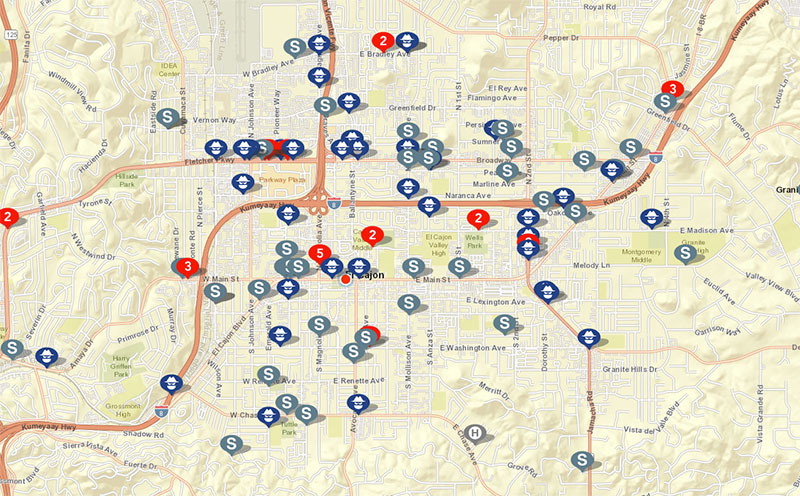
El Cajon crime map
Here’s a map showing you the location of all the violent crimes (murder, sexual assault and robbery) in El Cajon during the period of 6/30/2021 – 6/29/2022 – Community Crime Map
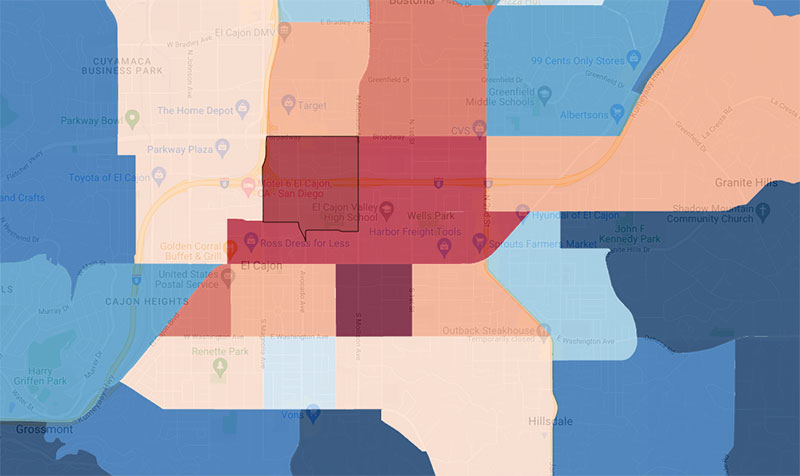
The not so great areas of El Cajon
A good general rule of thumb in El Cajon is to avoid the area bounded by Marshall Ave, Washington Ave, 3rd St and Broadway at night.
El Cajon’s crime rate vs other cities in California (2020)
Here’s how El Cajon’s crime rate compared to other cities in California. El Cajon had a similar crime rate to Long Beach and Riverside.
Here’s a list of the top 23 most dangerous cities in the United States ranked by violent crime rates.
City
Population
Violent Crime Rate per 100,000 people
Monroe
47,702
2,932.79
Memphis
633,104
2,418.24
Atlantic City
38,497
2,335.25
Saginaw
44,202
2,327.95
Detroit
639,111
2,248.44
St. Louis
301,578
1,995.17
Alexandria
45,275
1,877.42
Pine Bluff
41,253
1,808.35
Little Rock
202,591
1,805.11
Milwaukee
577,222
1,733.13
South Bend
103,453
1,706.09
Cleveland
372,624
1,689.10
Camden
71,791
1,632.52
Birmingham
200,733
1,577.22
Kansas City
508,090
1,558.58
Baltimore
585,708
1,460.11
Albuquerque
564,559
1,406.41
Chattanooga
181,099
1,382.67
San Bernardino
222,101
1,365.59
New Orleans
383,997
1,358.08
Oakland
440,646
1,347.34
El Cajon
105,432
496.05
Is Downtown El Cajon safe?
Downtown El Cajon is generally a safe area during the day. At night you want to make sure you stay in well-lit and well-populated areas.
Is the public transportation in El Cajon, CA safe?
The public transportation system in El Cajon is handled by the San Diego Metropolitan Transit System (MTS), which offers many routes that interweave throughout the entire city.
The MTS is generally a safe option to use during normal coummiting hours (6am – 7pm). Outside these hours, we recommend that you find a different mode of transportation.
Is El Cajon, CA safe at night?
El Cajon is generally a safe city at night as long as you avoid the sketchy areas. At night you should always stay in well populated areas and avoid walking through alleys or desolate areas. And as a woman you should also avoid walking far distance by yourself at night.
What do residents of El Cajon say about it’s safety?
El Cajon is fine. There’s some gangs there and meth is a problem.
Avoid the center city streets, the outer suburb areas are great and beautiful.
Be prepared to deal with meth addicts, homeless and mentally disturbed people. I try to stay away from El Cajon at night.
El Cajon is not the greatest part of San Diego but it’s not the worst either.
El Cajon isn’t the greatest area. There aren’t many places that feel “ghetto” around San Diego but there are large areas of El Cajon that definitely feels like it to me.
I’ve lived in El Cajon for 15 years and my parents still live there and it’s not a great area but it’s not as bad as people make it out to be. The city is being revitalized right now and developers are starting to build in the city.
Tips to stay safe while visiting El Cajon, CA
Avoid walking by yourself at night.
Don’t walk through deserted or desolate areas at night. Stay in places that are well populated.
Don’t leave valuables in your car. Put anything worth value in your trunk. Make your car as uninviting to thieves as possible.
Always trust your intuition. If you think something is amiss, remove yourself from that situation.
There’s no need to be courtesy to anyone that is making you feel uncomfortable.
Wait a second or two when the light turns green before crossing the street or driving through the intersection.
Facts about El Cajon, CA
The population of El Cajon in 2021 was 105,432.
The city covers a land area of 14.51 sq mi.
The median age was 32 years old.
85.1%% of residents 25 and older is a high school graduate. 22.1% of residents 25 and older has a bachelors degree or higher.
The median income for a household in the city was $56,367. The per capita income for the city was $25,940.
19.4% of the population live below the poverty line.
The median home value in El Cajon is $775K in 2022.
In 2022, the average rent for a El Cajon 2-bedroom apartment is $2,090.

")
")
")
")


")


Leave a Reply