To determine which cities in Louisiana are the most dangerous, we compiled data from the FBI’s Uniform Crime Report and sorted each city’s violent crime rate. Violent crimes include: murder, rape, robbery and aggravated assaults.
Violent crime rate is calculated by dividing the total numbers of violent crime by the total population; the result is multiplied by 100,000.
The Louisiana state average for violent crime is 639.4 per 100,000 people and its state average for property crime is 2,884.4 per 100,000 people.
What Is The Most Dangerous City In Louisiana?
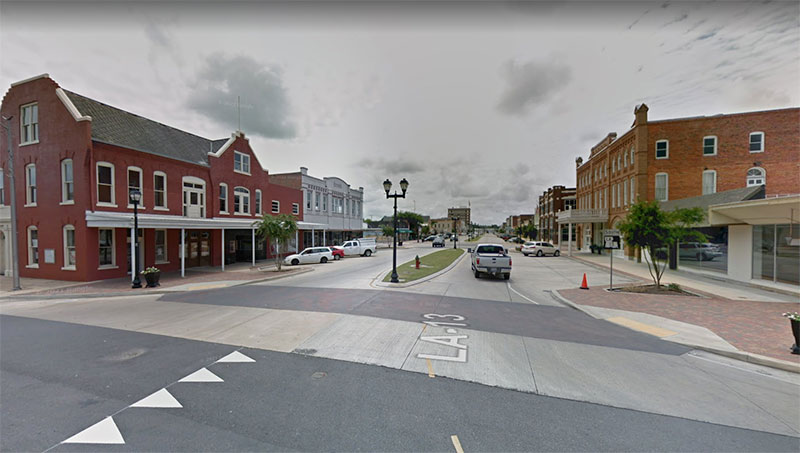
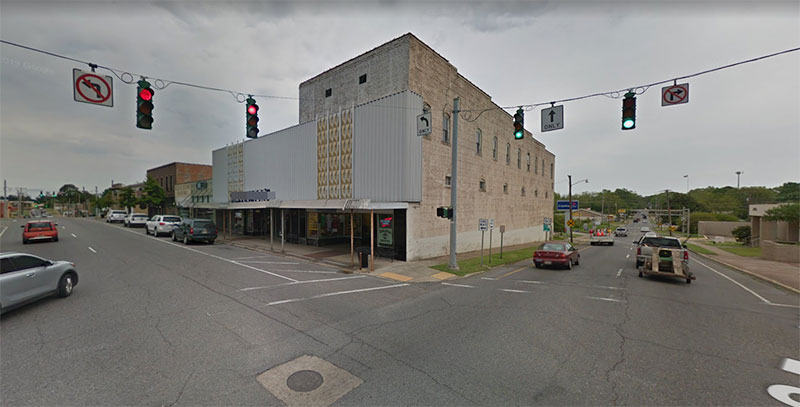
The most dangerous city in Louisiana is Opelousas. In 2019, Louisiana had a violent crime rate of 2,454.98 per 100,000 people and a property crime rate of 8,019.19 per 100,000 people.
Opelousas’s violent crime rate is 3.8x greater than the state average. It’s property crime rate is nearly 2.8x greater than the state average.
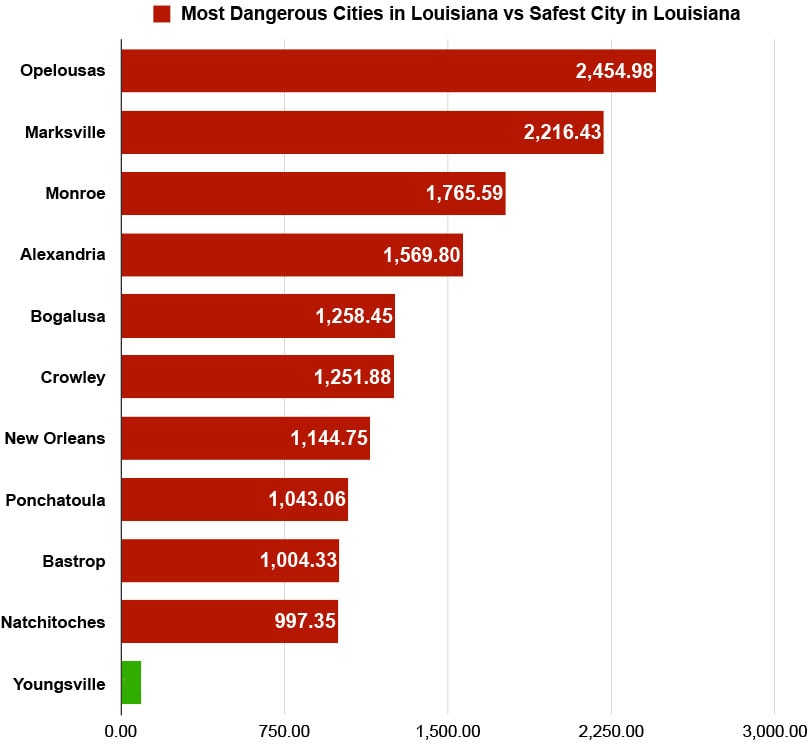
The Most Dangerous Cities In Louisiana VS The Safest City In Louisiana
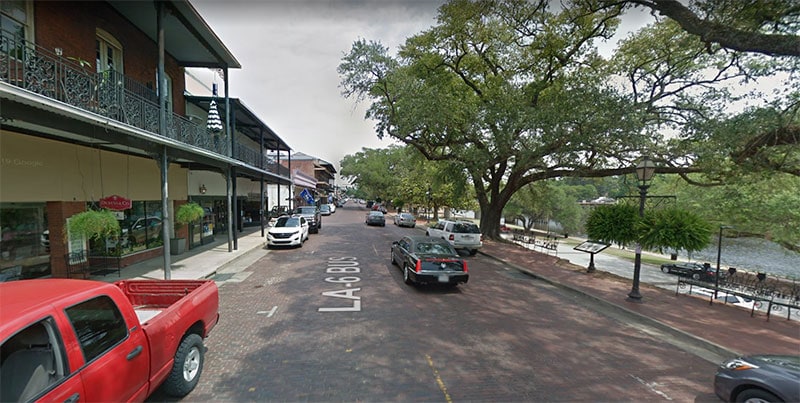
Here’s a graph showing you the violent crime rates of the top 10 most dangerous cities in Louisiana and we also included one of the safest city in Louisiana, Youngsville, to give you some perspective on the crime rates.
City
Population
Violent Crime Rate
1. Opelousas
16,049
2,454.98
2. Marksville
5,369
2,216.43
3. Monroe
47,746
1,765.59
4. Alexandria
46,630
1,569.80
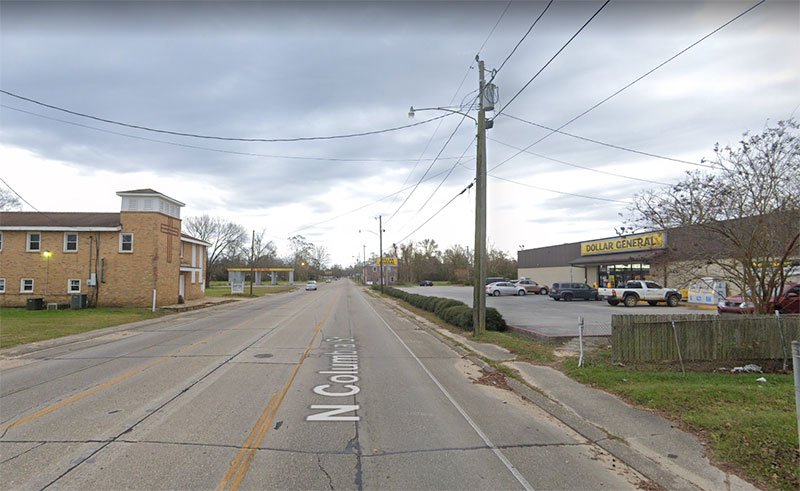
5. Bogalusa
11,681
1,258.45
6. Crowley
12,621
1,251.88
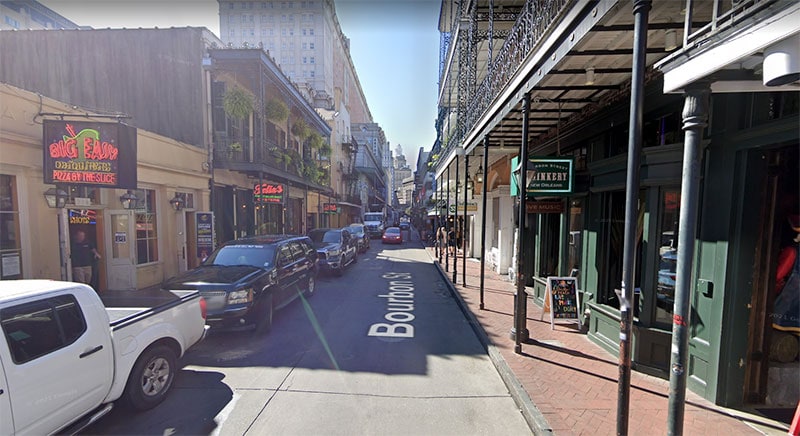
7. New Orleans
394,498
1,144.75
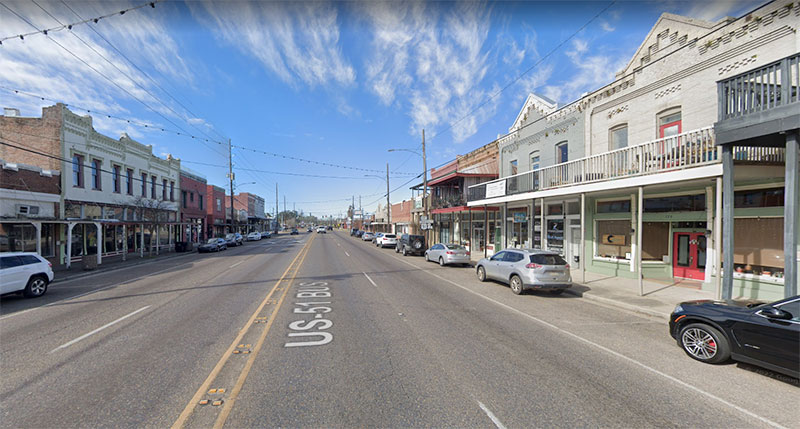
8. Ponchatoula
7,478
1,043.06
9. Bastrop
10,156
1,004.33
10. Natchitoches
17,747
997.35
11. Leesville
5,617
979.17
12. Baton Rouge
220,648
936.33
13. West Monroe
12,350
914.98
14. Church Point
4,424
881.56
15. Minden
11,984
876.17
16. Abbeville
12,142
831.82
17. Pineville
14,261
799.38
18. Bossier City
69,044
790.80
19. Shreveport
187,556
779.50
20. Pearl River
2,631
722.16
21. Kaplan
4,465
716.69
22. Gretna
17,729
671.22
23. Port Allen
4,940
668.02
24. Krotz Springs
1,208
662.25
25. Houma
32,771
637.76
26. Welsh
3,254
614.63
27. Gonzales
10,940
557.59
28. Winnfield
4,307
557.23
29. Thibodaux
14,587
555.29
30. Lake Charles
78,733
524.56
31. Walker
6,296
524.14
32. Lafayette
126,694
524.10
33. Tallulah
6,701
522.31
34. Vinton
3,291
516.56
35. Eunice
9,939
513.13
36. Farmerville
3,725
510.07
37. Breaux Bridge
8,237
509.89
38. Greensburg
653
459.42
39. Zachary
18,009
438.67
40. Kinder
2,388
418.76
41. Vidalia
3,871
413.33
42. Brusly
2,737
401.90
43. Springhill
4,792
396.49
44. Baker
13,240
385.20
45. Ruston
22,148
383.78
46. Bernice
1,611
372.44
47. Carencro
9,387
362.20
48. Erath
2,059
339.97
49. owa
3,262
337.22
50. Sulphur
20,200
326.73
50. Slidell
27,768
270.10
51. Port Vincent
751
266.31
52. Greenwood
3,141
254.70
53. Lake Arthur
2,778
251.98
54. Rayne
8,088
247.28
55. Broussard
12,985
246.44
56. Westwego
8,415
237.67
57. Kenner
66,653
223.55
58. Cullen
1,069
187.09
59. Addis
5,747
156.60
60. Mandeville
12,331
145.97
61. Scott
8,725
137.54
62. Harahan
9,298
129.06
63. Ville Platte
7,029
128.04
64. Lutcher
3,192
125.31
65. Gramercy
3,307
120.96
66. Oil City
980
102.04
67 Youngsville
15,020
93.21
68. Berwick
4,416
90.58
69. Jena
3,370
89.02
70. French Settlement
1,182
84.60
71. Westlake
4,959
60.50
72.Rayville
3,492
0.00
73. Blanchard
3,147
0.00
74. Many
2,704
0.0
75. Olla
1,349
0.00
76. Sibley
1,144
0.00
77. Epps
819
0.00
78. Georgetown
326
0.00
79. Norwood
295
0.00
80. Ida
205
0.00
You might also be interested in these other states:


")


Leave a Reply