If you are thinking about visiting Hartford and have some qualms about the safety of the city, we got you covered.
We are going to deep dive into crime rates, crime statistics, crime maps, crime graphs and talk to the residents of the city to give you a better understanding of how safe Hartford really is.
What is Hartford, CT crime rate?
In 2021, Hartford had a crime rate of 635.31 per 100,000 people, which is 1.6 times greater than the national average. It’s property crime rate of 2,778.05 per 100,000 people is 1.4 times greater than the national average.
Hartford’s crime rate breakdown
Violent Crime Rate
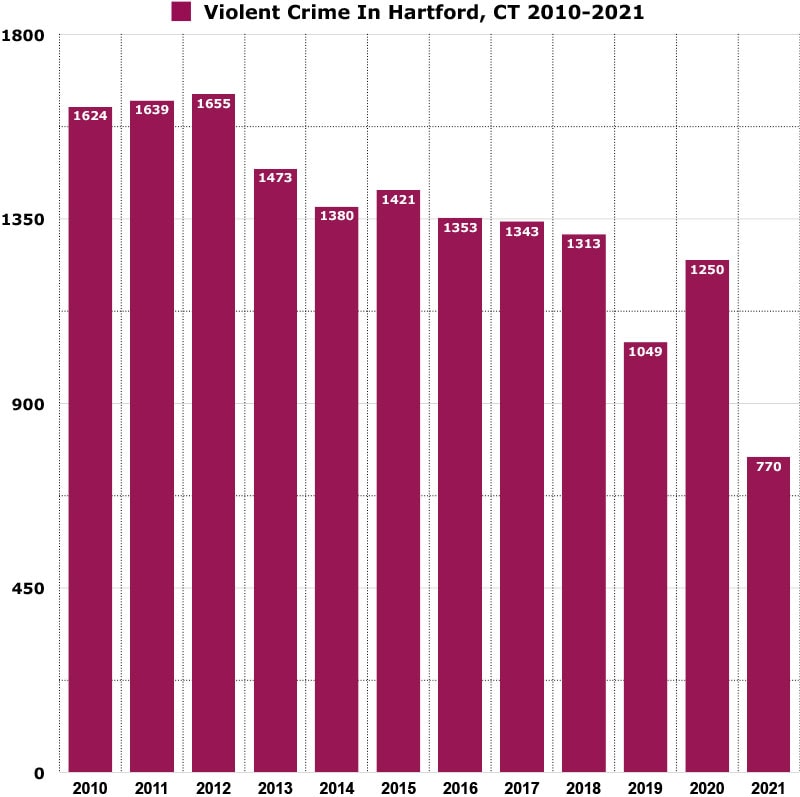
In 2021, Hartford reported 770 violent crimes: 34 homicides, 47 rapes, 167 robberies and 522 aggravated assaults.
Year over year violent crime has decreased by 38.4%.
Hartford violent crime rate of 635.31 is similar to Seattle, Atlanta and Los Angeles.
You have a 1 in 157 chance of becoming a victim of violent crime in Hartford.
Here’s a graph showing you how violent crime has trended over the last 12 years in Hartford:
Violent crime in Hartford has been steadily decreasing since 2018.
*Violent crimes includes; homicides, rape, robbery and aggravated assaults and the violent crime rate is calculated by dividing the number of reported crimes by the total population; the result is multiplied by 100,000.
Murder Rate
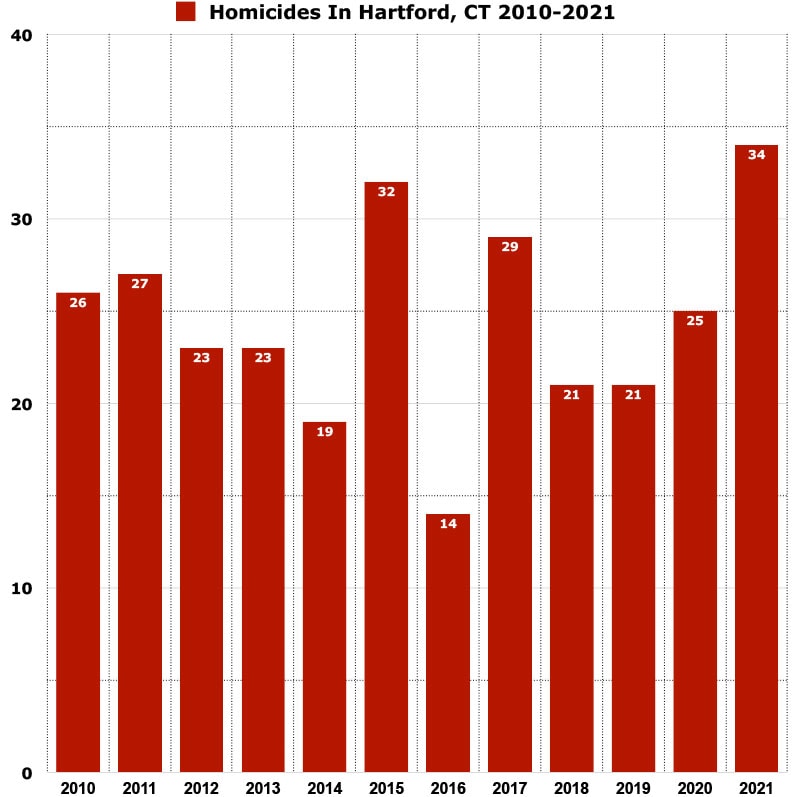
In 2021, Hartford reported 34 murders and had a murder rate of 28.05 per 100,000 people.
Year over year murders has increased by 36%.
Hartford’s murder rate is 4.3 times greater than the national average.
You have a 1 in 3,565 chance of becoming a victim of murder in Hartford.
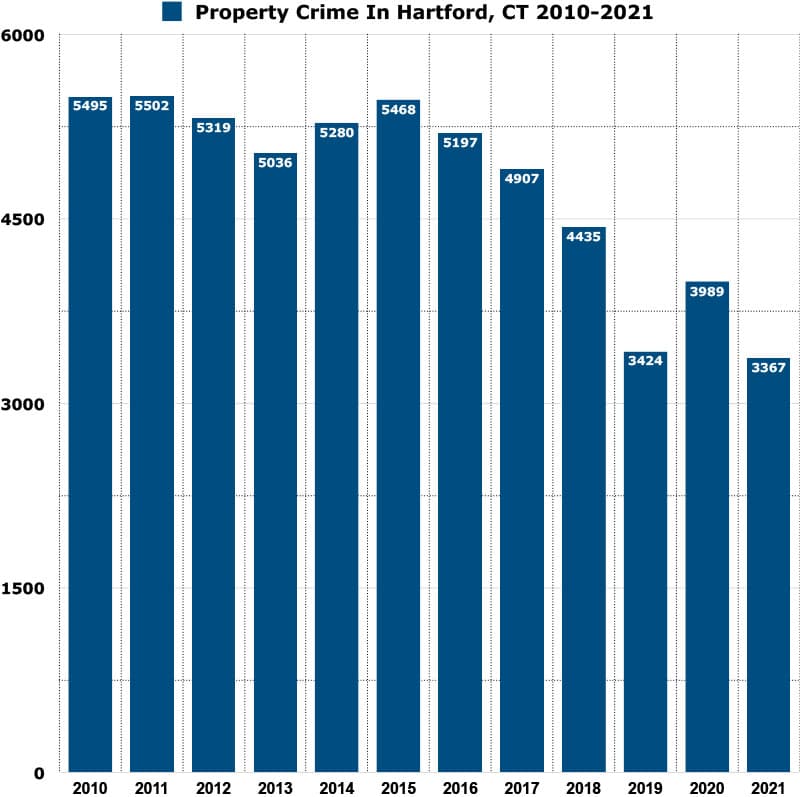
You have a 1 in 36 chance of becoming a victim of property crime in Hartford.
Here’s a graph showing you how violent crime has trended over the last 12 years in Hartford:
Property crime in Hartford has been steadily decreasing over the last 12 years.
*Property crimes include; burglary, larceny/theft, motor vehicle theft, and arson and property crime rate is calculated by dividing the number of reported crimes by the total population; the result is multiplied by 100,000.
How are Hartford’s crime rates calculated?
Crime rate is calculated by dividing the number of reported crimes by the total population; the result is multiplied by 100,000.
For example, in 2021 there were 34 murders in Hartford and the population was 121,200. This equals a murder rate of 28.05 per 100,000 residents.
Hartford’s crime rate vs other cities in Connecticut (2020 Crime Rates)
Here’e how Hartford’s crime rate compared to other cities in Connecticut. In 2020, Hartford has the highest crime rate of all the cities listed.
Population
Crime Rate
Hartford
121,054
1032.60
New Haven
134,023
687.94
Bridgeport
148,654
557.67
New Britain
74,135
400.62
Waterbury
114,403
349.64
Stamford
135,470
209.64
Norwalk
91,184
156.83
Danbury
86,518
113.27
West Hartford
64,083
46.81
Fairfield
61,512
42.27
Greenwich
63,518
12.59
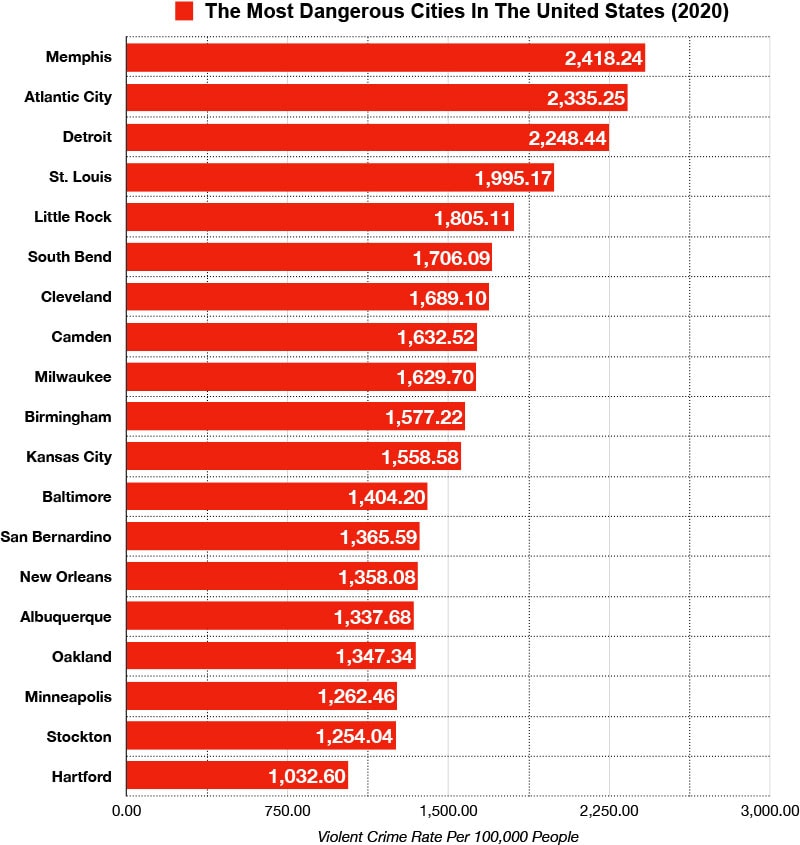
Hartford, CT vs The Most Dangerous Cities in the United States (2020 Crime Rates)
Here’s a list of the top 19 most dangerous cities in the United States ranked by violent crime rates. Hartford’s violent crime rate in 2020 is 2.4 times less than Memphis, the most dangerous city on the list.
Hartford, CT Crime Stats (2021)
Here’s a breakdown of all the crimes in the city for 2020 compared to 2021:
In 2021, Hartford reported 4137 total crimes, which is a 21% decrease over 2020.
In 2021, Hartford reported 770 violent crimes, which is a 38.4% decrease over 2020.
In 2021, Hartford reported 34 murders, which is a 36% increase over 2020.
In 2021, Hartford reported 3,367 property crimes, which is a 15.6% decrease over 2020.
Most dangerous neighborhoods in Hartford, CT
The North End of Hartford is the most dangerous area of the city.
The South End around Wethersfield Ave or Franklin Ave are not great areas as well.
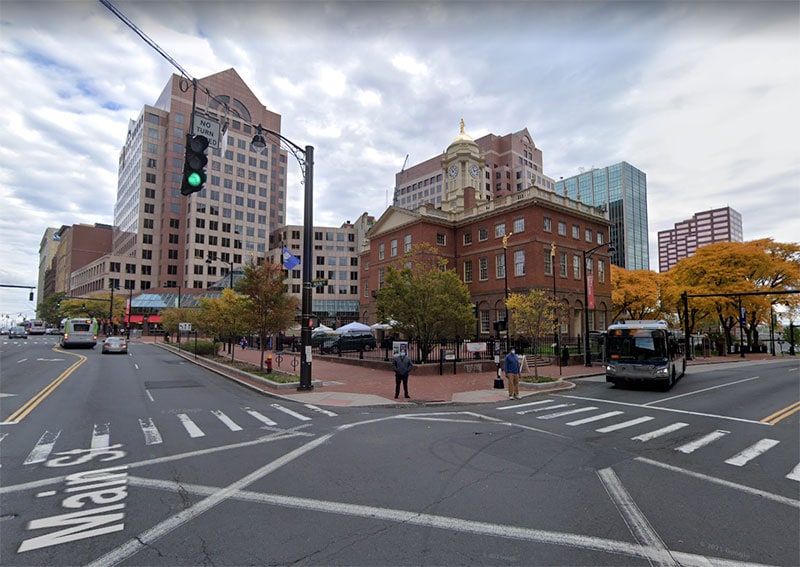
Is Downtown Hartford safe?
Downtown Hartford is generally a safe area to visit and while Hartford has rough areas, the downtown area is not one of them.. There is a good amount of police presence and there are also ambassadors that walk around downtown to help secure the area and make it feels safe.
Many residents also mention that they feel very safe in the downtown Hartford, however they would avoid walking far distances late at night.
Is the public transportation in Hartford safe?
The public transportation system in Hartford is handled by the CT Transit and it offers many routes that interweave throughout the entire city. The CT Transit is generally a safe method of transportation to get around the city during commuting hours (7am – 6pm). We do not recommend that you use the transit before or after these hours and you should opt for a taxi or ride sharing service instead.
Is Hartford safe at night?
Hartford is generally safe at night as long as you stay out of the problem areas. Be aware that streets and squares that are perfectly safe to visit in the daytime can be questionable and sketchy at night. Stay in well lit and populated places at night and avoid walking through desolate areas.
Hartford is also not a place you want to be wandering around aimlessly at night, so save the sight seeing for the daytime.
What do residents of Hartford say about it’s safety?
"The best areas in Hartford are probably deep in down town, or the west end. The closer you are to West Hartford, the better it is."
"Generally speaking, if you are in the West End of Hartford, it is very safe. The entire north end is the most unsafe part of Hartford and the south end has a couple not so great spots."
"Avoid the north end. The west end is great and downtown is safe."
"The North End of Hartford and mostly around Albany ave is extremely dangerous."
"The north end is a rought area. The South end has gone downhill. Downtown is nice and West Hartford is very nice."
Tips to stay safe while visiting Hartford, CT
Do you research before you visit and figure out which parts of the city you should avoid. Plan your trip accordingly.
Don’t walk through the North End at night
Don’t leave any valuable items in your car or in plain sight in your car. Take them with you or leave it in the trunk.
Park in well lit places or parking garages with security.
Plan all your routes beforehand and know how to get to your location and how to get back.
Is Hartford, CT safe?
Statistically speaking, Hartford is a slightly unsafe city. In 2021 Hartford has done a phenomneal job of reducing violent crime in the city, almost 40%. However, Hartford still suffers from a very high murder rate that rivals cities like Washington D.C. and Cincinnati.
Here’s a scale to give you some perspective on Hartford’s crime rate:
Facts about Hartford, CT
The population of Hartford in 2021 is 121,200.
The city covers a land area of 17.38 square miles.
The median age in the city is 30 years old.
74.5% of residents 25 and older is a high school graduate. 16.9% of residents 25 and older has a bachelors degree or higher.
The median income for a household in the city was $36,278. The per capita income for the city was $21,163.
28.1% of the population live below the poverty line.
The median home value in Hartford is $175,000 in 2022.
In 2022, the average rent for a Hartford 2-bedroom apartment is $1,275.


")
")
")
")
")
")
")
")
")
Leave a Reply