If you are thinking about visiting Newark and have some qualms about the safety of the city, we got you covered.
We are going to deep dive into the statistics, look at some maps, graphs and talk to the residents of the city to give you a better understanding of how safe Newark really is.
Is Newark, New Jersey Safe To Visit?
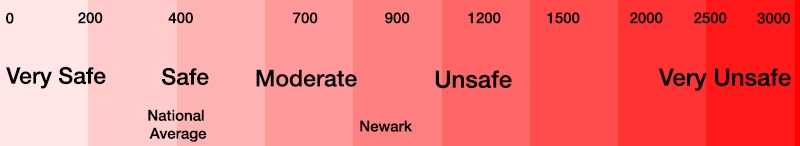
Statistically speaking, Newark is a slightly unsafe place to visit. In 2019, Newark had a violent crime rate of 896.45 per 100,000 people and a property crime rate of 2,395.01 per 100,000 people. It’s violent crime rate is and is 2.4x greater than the national average and is on par with cities like Philadelphia, Cincinnati and Washington D.C.
Here’s a scale to give you some perspective on Newark’s violent crime rate:
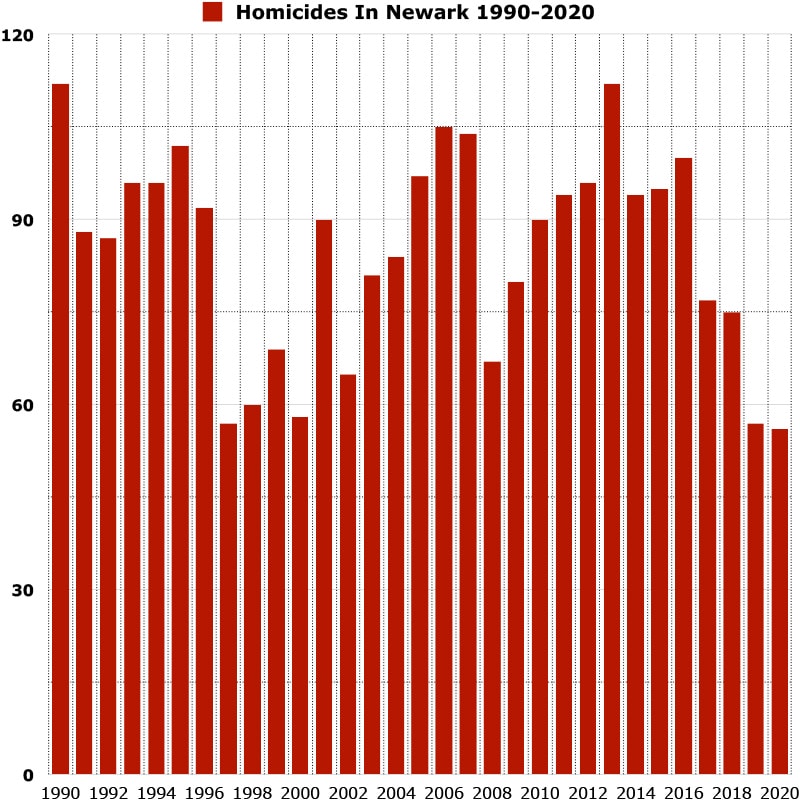
Newark’s Murder Stats
In 2020, Newark reported 56 homicides and had a homicide rate of 17.97 per 100,000 people.
Newark’s homicide rate is 2.8x greater than the national average and 4.9x greater than the state average.
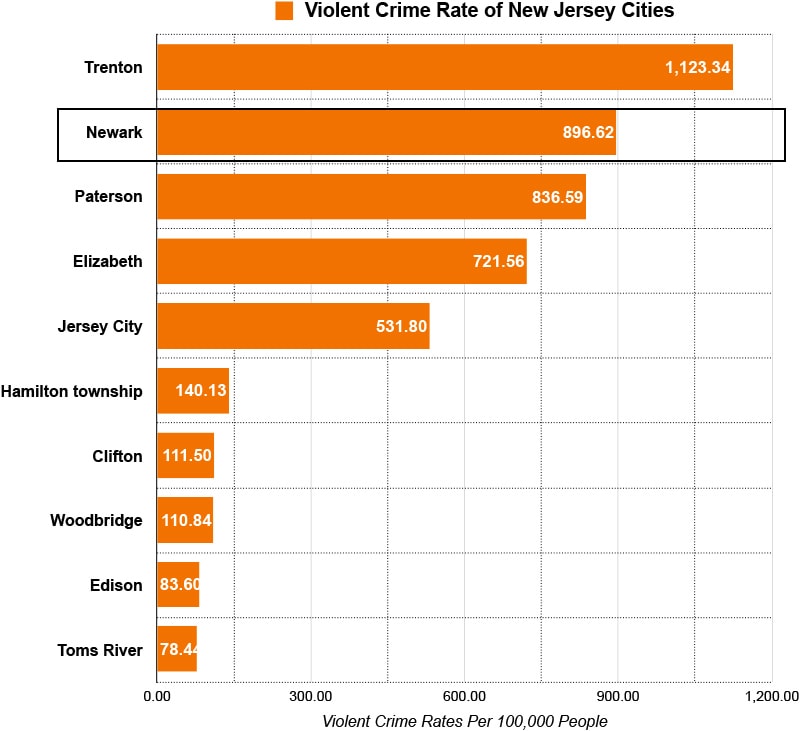
Here’s a graph showing you the violent crime rates of the 11 most populous cities in New Jersey. Newark’s violent crime rate ranked 2nd highest among all cities.
City
Population
Violent Crimes 2019
Violent Crime Rate 2019
Trenton
83,412
937
1,123.34
Newark
281,054
2,520
896.62
Paterson
145,710
1,219
836.59
Elizabeth
128,333
926
721.56
Jersey City
261,940
1,393
531.80
Hamilton township
87,065
122
140.13
Clifton
85,204
95
111.50
Woodbridge
100,145
111
110.84
Edison
100,477
84
83.60
Toms River
91,785
72
78.44
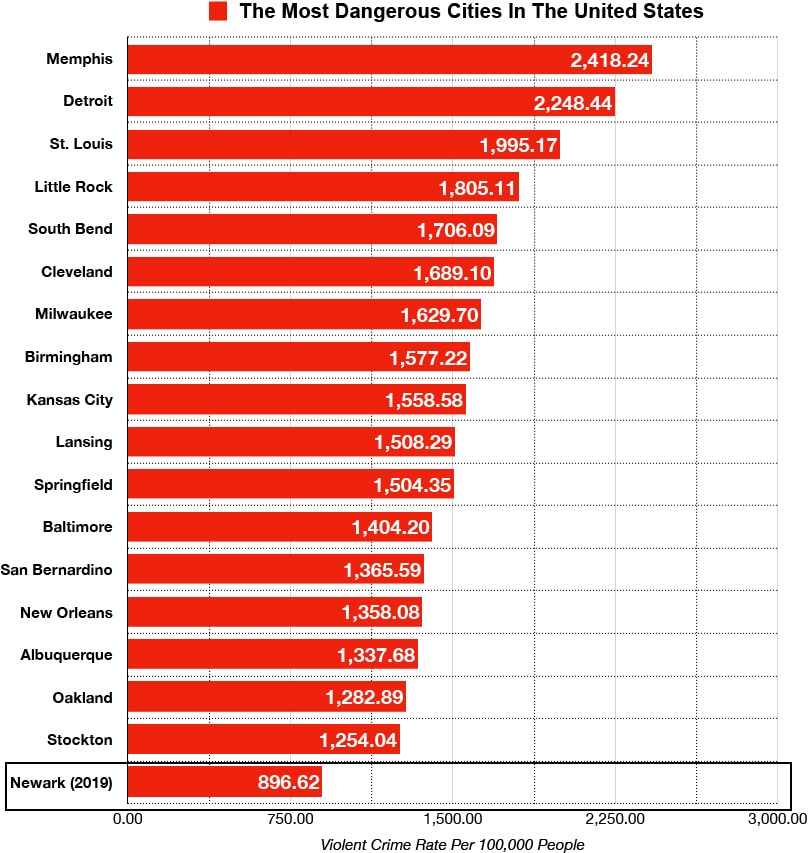
Newark, New Jersey vs The Most Dangerous Cities in the United States
Here’s a list of the top 18 most dangerous cities in the United States ranked by violent crime rates. Newark’s violent crime rate is 3.3x less than Memphis, the most dangerous city on the list.
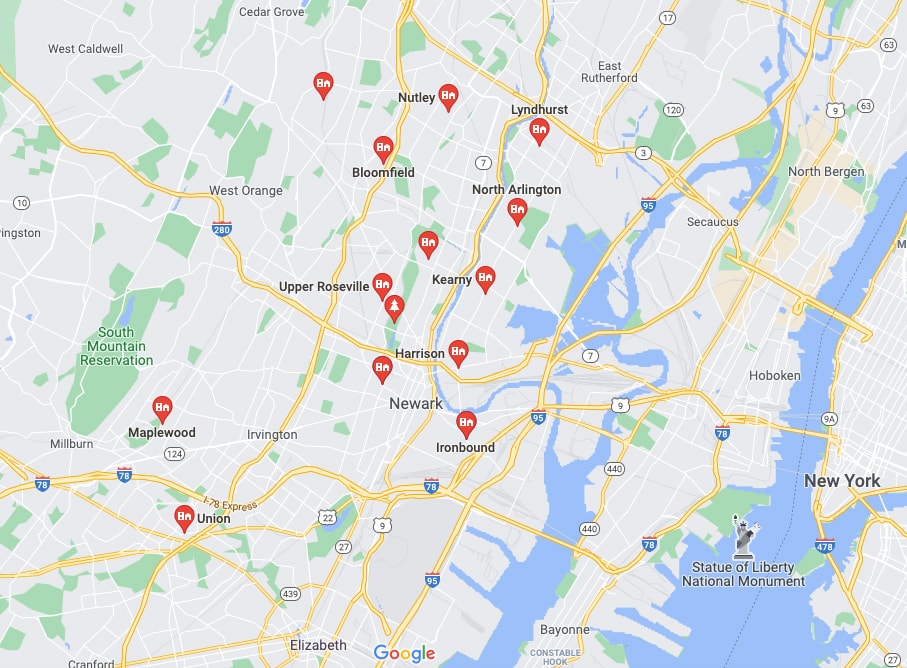
Here’s a map showing you where gangs are most active in Newark:
Vailsburg
Weequahic
Clinton Hill
Central Ward
South Ward
Safest neighborhoods In Newark, New Jersey
East Ward
North Ward
Ironbound
University Heights
Forest Hill
Branch Brook
Bloomfield
Union
Nutley
Kearny
Montclair
Harrison
North Arlington
Lyndhurst
Maplewood
South Orange
Upper Roseville
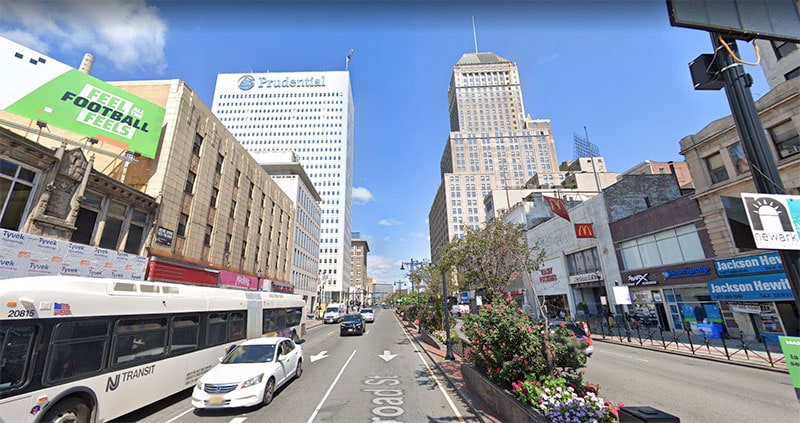
Is Downtown Newark, New Jersey Safe?
Downtown Newark is generally a very safe area to visit during the day time. At night we recommend that you take extra precautions and stay in well populated places, don’t stray off the beaten path and don’t walk by yourself at night.
Many residents mention that downtown Newark is like the Financial District of New York, where everything kind of shuts down around 7-8 PM and so there’s not much going on after dark outside of event nights.
Is the public transportation in Newark safe?
The public transportation system in Newark is handled by NJ Transit and it offers a plethora of routes that interweave throughout the entire city and its surrounding neighborhoods and is safe
It is generally safe during commuting hours (8am – 8pm), however we do not recommend that you take public transportation night. You should opt for a taxi or ride sharing service instead.
What do residents of Newark say about it’s safety?
"Newark is broken down in 5 wards and I would say east ward has the least amount of crime and is the safest."
"Newark is strange in that you can walk down one street and its nice homes with well manicured lawn and then you walk a few block and you’re in urban decay."
"The Ironbound section in the East Ward of Newark is probably the best and safest area."
"Newark is about as safe as any other urban city. Just be cautious of South Newark and the Central Ward."
"Newark gets a bad rap but overall crime is not what it is made out to be."
"Newark is not any more dangerous than other big city. Violent crime usually occurs between people who know each other and a small number is random violence."
Is Newark safe for women?
Newark is generally safe for female solo travelers as long as you learn the layout of the city, avoid problem areas, stay in well lit/well populated areas and avoid walking by yourself at night.
Is Newark safe at night?
Newark is safe at night as long as you avoid the sketchy neighborhoods mentioned above. Streets and squares that are perfectly safe in the day can be questionable at night. Save the sightseeing for the daytime and and avoid any places that are outside normal pedestrian areas at night.
Tips to stay safe while visiting Newark, New Jersey
Learn the layout of the city and avoid areas where crime is high and book your accommodations accordingly.
Create a detailed itinerary of places you want to visit, scout out the locations ahead of time using Google Street View and see if it’s an area that you are comfortable with visiting.
Always be aware of your surroundings. It’s easy to let your guard down but you should always maintain a level of awareness wherever you are.
Always be aware of your belongings. Don’t leave things unattended.
Don’t wak by yourself at night, especially if you are a woman. Avoid walking through alleys and desolate areas. Avoid using public transportation at night.
Don’t leave valuables in your car. Or if you cant avoid it, don’t leave it in plain sight.
Trust your gut and intuition. If something doesn’t seem right, remove yourself from the situation.
Don’t be a walking advertisement. Leave the expensive jewelry, watches, purses and clothing at home.
There’s homeless people on the streets in downtown. The ones that are asleep on the sidewalk are fine, just keep walking. Keep your distance from the ones yelling and carrying a weapon.
Get used to saying “no, sorry” if anyone comes up to you. Don’t engage people trying to give you stuff. More than likely they are trying to scam you.
Never stop walking. If someone says “hey”, just keep walking. As soon as you stop, you are giving someone the opportunity to solicit your for money, sign up for something or scam you. Speed = safety.
Quick Facts About Newark, New Jersey
Newark, New Jersey
United States
Population, Census, April 1, 2020
311,549
331,449,281
Population, Census, April 1, 2010
277,140
308,745,538
Persons under 5 years, percent
7.4%
6.0%
Persons under 18 years, percent
24.6%
22.3%
Persons 65 years and over, percent
10.5%
16.5%
Black or African American alone, percent
50.1%
13.4%
American Indian and Alaska Native alone, percent
0.3%
1.3%
Asian alone, percent
1.9%
5.9%
Native Hawaiian and Other Pacific Islander alone, percent
0.0%
0.2%
Two or More Races, percent
2.4%
2.8%
Hispanic or Latino, percent
36.3%
18.5%
White alone, not Hispanic or Latino, percent
11.0%
60.1%
Foreign born persons, percent, 2015-2019
31.8%
13.6%
Median value of owner-occupied housing units, 2015-2019
$245,200.00
$217,500.00
Median selected monthly owner costs -with a mortgage, 2015-2019
$2,158.00
$1,595.00
Median gross rent, 2015-2019
$1,085.00
$1,062.00
Households with a broadband Internet subscription, percent, 2015-2019
69.5%
82.7%
High school graduate or higher, percent of persons age 25 years+, 2015-2019
75.3%
88.0%
Bachelor’s degree or higher, percent of persons age 25 years+, 2015-2019
15.3%
32.1%
In civilian labor force, total, percent of population age 16 years+, 2015-2019
61.2%
63.0%
Median household income (in 2019 dollars), 2015-2019
$35,199.00
$62,843.00
Per capita income in past 12 months (in 2019 dollars), 2015-2019
")
")
")
")
")
")
")
")
")
Leave a Reply