If you are thinking about visiting Washington DC and have some qualms about the safety of the city, we got you covered.
We are going to deep dive into the statistics, look at some maps, graphs and talk to the residents of the city to give you a better understanding of how safe Washington DC really is.
Is Washington D.C. Safe To Visit?
Statistically speaking, Washington DC is a slightly unsafe place to visit. Out of the 100 most populous cities in the United States, Washington DC’s violent crime rate ranks 24th highest. In 2020, Washington DC had a violent crime rate of 990.22 incidents per 100,000 residents is on par with cities like Philadelphia, Atlanta and Cincinnati.
It also had the 15th highest murder rate in the United States at 28.7 per 100,000 people
Washington D.C.’s Population
The population for the Washington DC in 2020 was 689,545.
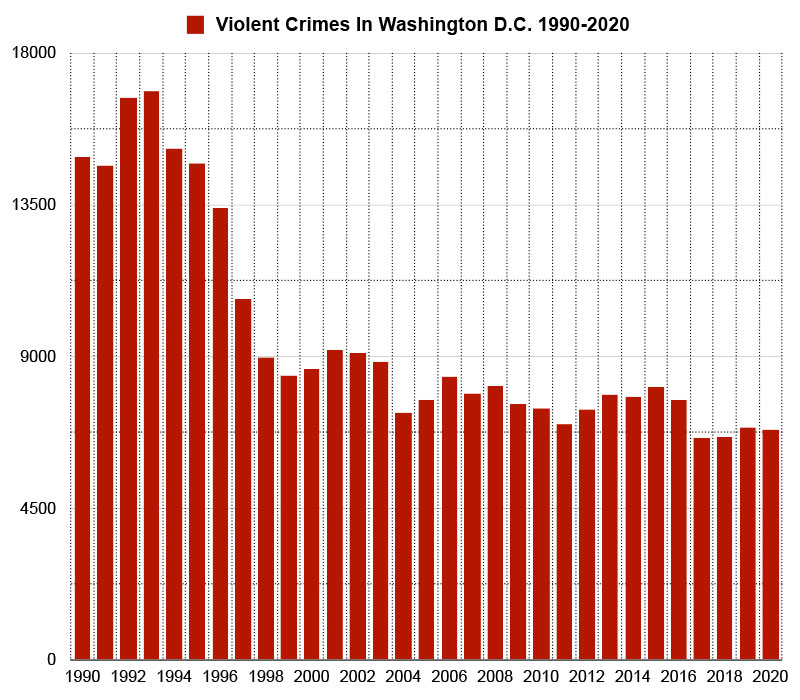
In 2020 Washington DC reported 6,828 violent crimes and had a violent crime rate of 990.22 per 100,000 people.
The national average for violent crime is 398.5 per 100,000 residents. Washington DC’s violent crime rate is 2.5 times greater than the national average.
Year over year violent crime has decreased by 1%.
Here’s a map showing you how violent crime has trended in Washington DC over a 30 year period.
Violent crime peaked in 1993 when there were 16,888 violent crimes reported and the city had a violent crime rate of roughly 2,782.67 per 100,000 people.
Violent crime has decreased over 60% from it’s 30-year high in 1993.
*Violent crimes include; homicides, rape, robbery and aggravated assaults and the violent crime rate is calculated by dividing the number of reported crimes by the total population; the result is multiplied by 100,000.
Washington D.C.’s Property Crime Rate
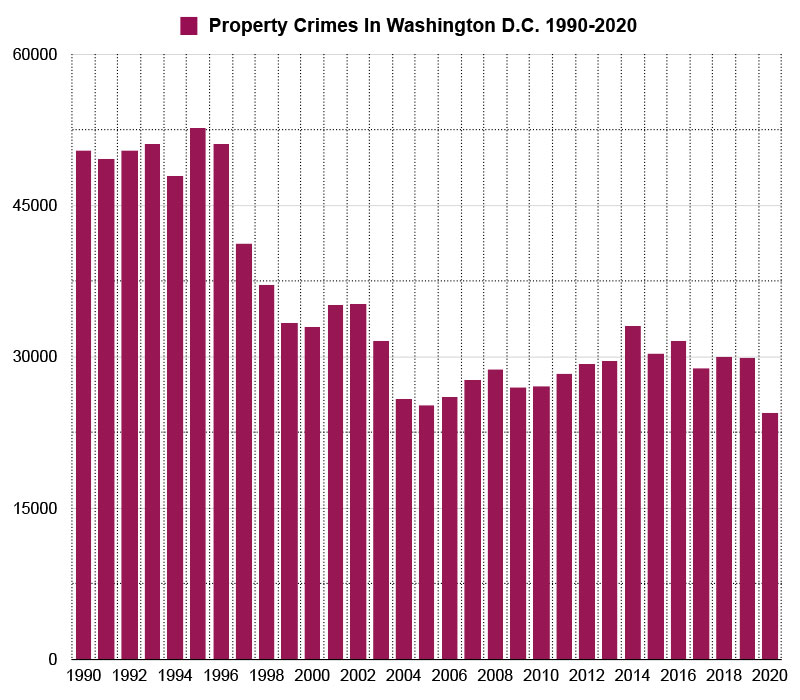
In 2020 Washington D.C. reported 26,667 property crimes and had a property crime rate of 3,867.33 per 100,000 people.
The national average for property crime is 1958.2 per 100,000 residents. Washington DC’s property crime rate is 1.97 times greater the national average.
Year over year property crime in Washington DC has decreased by 12%.
Here’s a map showing you how property crime has trended in Washington DC over a 30 year period.
Property crime peaked in 1995 when there were 52,657 property crimes reported and the city had a property crime rate of roughly 8,676.39 per 100,000 people.
Property crime has decreased over 49% from it’s 30-year high in 1995.
**Property crimes include; arson, burglary, larceny-theft, and motor vehicle theft are classified as property crimes. The property crime rate is calculated by dividing the number of reported crimes by the total population; the result is multiplied by 100,000.
Washington D.C.’s Murder Stats
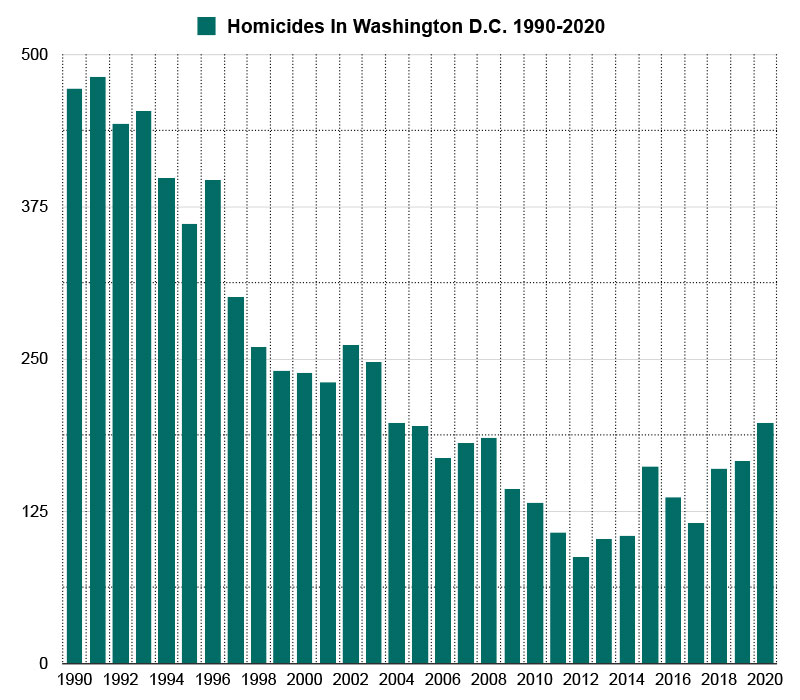
In 2020 Washington DC reported 198 homicides, which was a 19% increase from 2019 where 166 homicide was reported.
In 2020 Washington DC had a homicide rate of 28.7 per 100,000 people.
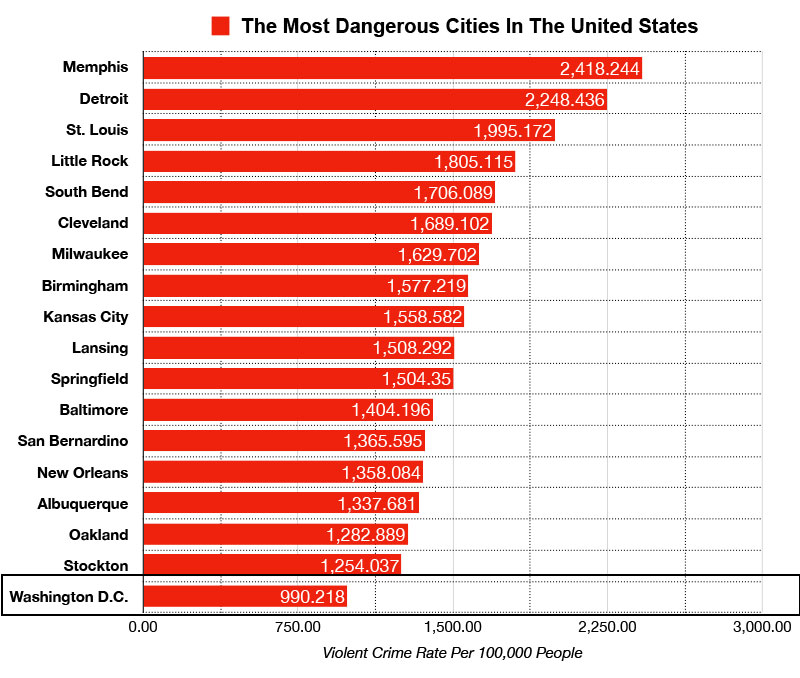
Washington D.C. vs The Most Dangerous Cities In The United States
Here’s a list of the top 17 most dangerous cities in the United States ranked by violent crime rates. Washington DC’s violent crime rate is 2.4 times less than Memphis, the most dangerous city in the United States.
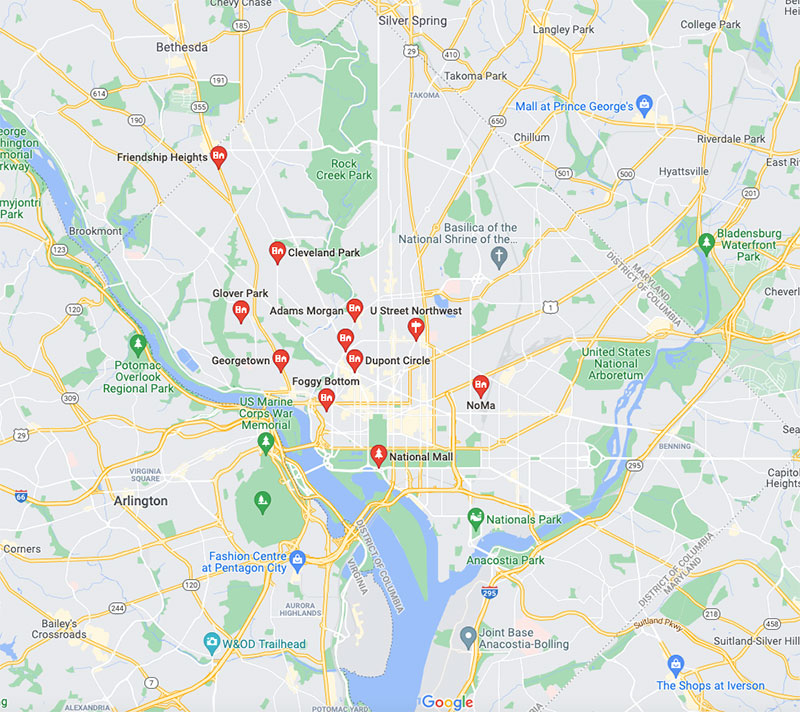
Here’s a map showing you the where gangs are most active in the city:
Safest Neighborhoods In Washington D.C.
National Mall
Georgetown
Glover Park
Cleveland Park
Friendship Heights
Kalorama
Dupont Circle
Foggy Bottom/West-End
U street Corridor
Adams Morgan
NoMa
What do residents of Washington D.C. say about its safety
"Avoid anything east of the river. Yes there are pockets of improved places but many still need work."
"South East DC is probably the roughest part of the city."
"Avoid places on or off of Georgia. That street is a hellhole."
"Washington has come a long way from the 90’s when it was nicknamed ‘The Murder Capital of the US’. Things have gotten a lot better but there are still areas you shouldn’t go at nights."
"The touristy parts of DC are perfectly safe. The dangerous areas are places you wouldn’t want to visit anyways."
"If you are on or around the Capital Mall, you’ll be in one of the safest areas of the city."
"Most of DC is pretty shady with the exception of upper Northwest and the National Mall."
"Every city has its good areas and bad areas. In DC the the deeper you get into north-east and south-east, the more dangerous it is. The good area is north-west."
"Avoid east of the Anacostia River."
"The bad parts of town are extremely far from the places that visitors come to see. You don’t happen upon them by accident."
"DC was a shit show back in the 80s and 90s when crack hit the city hard. It’s cleaned up a lot though and gentrificiation is hitting a lot of formerly bad neighborhoods."
As long as you stay in the touristy areas and don’t deviate too far from those areas, you should be fine."
Is The Washington D.C. Metro Safe?
The D.C. Metro is generally safe during daytime commuting hours. Late at night it can feel a bit sketchy as less people are using the trains. Avoid traveling alone on the metro after 9 pm. Lyft/taxis are always a better and safer option.
Here are some tips to help you have a safer trip while using the metro:
Ride the front car so you have access to the conductor.
Never get in a car that no one else is in. Crowds are generally your friend.
Don’t make prologned eye contact with others.
Don’t make eye contact with erratic people.
Don’t put headphones on so you can hear what’s going on around you. Having your headphones on also makes you a target.
Any time there is a potential problem, change cars.
Download the MetroHero app to your phone. The wait times and announcements about delays are extremely reliable.
Avoid secluded areas on the train platform. Stick around where there are other people.
Don’t leave your purse/phone out if you are standing near the doors as it makes for an easier target for exiting thieves.
When you’re on the escalator, stand on the right and walk on the left.
If someone starts asking you for money or directions, just ignore them.
Is Washington D.C. Safe For A Woman?
Washington D.C. is safe for female solo travelers, as long as you learn the layout of the city, avoid problem areas and follow general precautionary measures.
Tips For Visiting Washington D.C.
Don’t stand on the left side of the escalators even if you think nobody is behind you. That’s very, very important.
The National Mall is way cooler at night, and not many tourist know about this. The Korean War memorial is more powerful and moving at night. The lighting really brings out the fear in the faces of the soldiers.
Learn the layout of the city before you visit. When booking a hotel or searching for directions, look at google street view so you don’t book yourself into a hotel in a sketchy area.
Avoid walking through alleys at night.
Stick to well-trafficked and brightly lit areas at night.
Make sure you gas tank is full, especially at night. You don’t want to have to fill up your gas tank in an sketchy and unfamiliar area.
If you are traveling alone, blend in as much as you can. You’re already at a disadvantage with criminals when you’re on your own, don’t make it easier for them to spot an outsider.
Don’t drink in excess and be careful drinking on your own or with people you don’t know.
Never keep your wallet in your back pocket. Put your wallet and phone in a front pants pocket.
Trust your instincts and your gut feeling. If you don’t feel safe, if something feels wrong, don’t do it, don’t go, etc.
Don’t wear expensive-looking jewelry/clothing. Try to look fairly inconspicuous.
Be skeptical of people who are attempting to “help” you unsolicited – Thieves usually work in teams – one to draw your attention away and the other to steal your goods.
You don’t really need a car in D.C. The metro is kind of limited compared to some cities, but the bus service is really quite good. Capital Bikeshare is another great way to explore the city.
Download the CityMapper app. It gives you options between transit types, it will alert you of metro issues and it will also give you directions involving bikeshare or using your own bike.
Washignton D.C. has come a long way from shedding its ‘Murder Capital of the World’ reputation from the 90’s. Effective leadership, policing and gentrification has brought crime down in all categories.
Statistically it still register closer to the unsafe spectrum. The violent crime and property crime rates are still noticeably high and there are huge swaths of Washington D.C. that you should avoid, specifically, east of the river and north-east D.C. However, these are generally areas that a tourist wouldn’t want to visit anyways.
If you stick to the National Mall area and the north-west parts of the city and if you follow the safety tips posted above, you can mitigate a lot of your chances of becoming a victim of crime.
Quick Facts About Washington DC
Fact
Washington, District of Columbia
United States
Population, Census, April 1, 2020
689,545
331,449,281
Population, Census, April 1, 2010
601,723
308,745,538
Black or African American alone, percent
46.3%
13.4%
American Indian and Alaska Native alone, percent
0.3%
1.3%
Asian alone, percent
4.0%
5.9%
Native Hawaiian and Other Pacific Islander alone, percent
0.1%
0.2%
Two or More Races, percent
3.1%
2.8%
Hispanic or Latino, percent
11.0%
18.5%
White alone, not Hispanic or Latino, percent
36.6%
60.1%
Foreign born persons, percent, 2015-2019
13.7%
13.6%
Median value of owner-occupied housing units, 2015-2019
$601,500.00
$217,500.00
Median selected monthly owner costs -with a mortgage, 2015-2019
$2,569.00
$1,595.00
Median gross rent, 2015-2019
$1,541.00
$1,062.00
High school graduate or higher, percent of persons age 25 years+, 2015-2019
90.9%
88.0%
Bachelor’s degree or higher, percent of persons age 25 years+, 2015-2019
58.5%
32.1%
In civilian labor force, total, percent of population age 16 years+, 2015-2019
69.9%
63.0%
Median household income (in 2019 dollars), 2015-2019
$86,420.00
$62,843.00
Per capita income in past 12 months (in 2019 dollars), 2015-2019
")
")
")
")
")
")
")
")
")
Leave a Reply