If you are thinking about visiting Cleveland and have some qualms about the safety of the city, we got you covered.
We are going to deep dive into the statistics, look at some maps, graphs and talk to the residents of the city to give you a better understanding of how safe Cleveland really is.
Is Cleveland Safe To Visit?
Cleveland is not a safe place to visit. It consistently ranks on the list of most dangerous cities in the United States. In 2020 it had the 10th highest violent crime rate and it had the 9th highest murder rate in the country.
Cleveland’s Population
The population for the Cleveland in 2020 was 372,624
Cleveland Crime Stats
Here’s a breakdown of all the crimes in Cleveland for 2019 and 2020.
*Violent crimes include; homicides, rape, robbery and aggravated assaults and the violent crime rate is calculated by dividing the number of reported crimes by the total population; the result is multiplied by 100,000.
Cleveland Property Crime Rate
In 2020 Cleveland reported 18,422 property crimes and had a property crime rate of 4,943.9 per 100,000 people.
The national average for property crime is 1958.2 per 100,000 residents. Cleveland’s property crime rate is 252% greater the national average.
Ohio’s property crime rate is 1850.3 per 100,000. Cleveland’s property crime rate is 267% greater than the state national average.
Out of the 100 most populous cities in the United States, Cleveland’s property crime rate ranked 17th highest.
**Property crimes include; arson, burglary, larceny-theft, and motor vehicle theft are classified as property crimes. The property crime rate is calculated by dividing the number of reported crimes by the total population; the result is multiplied by 100,000.
Cleveland Murder Stats
In 2020 Cleveland reported 177 homicides, which was a 15.8% increase over 2019, where 123 homicides were reported.
177 is the most number of homicides reported in Cleveland since 1991 where 175 homicides were recorded.
In 2020 Cleveland had a murder rate of 47.5 per 100,000 residents and had the 7th highest murder rate in the nation.
The national murder rate is 6.5 per 100,000 people. Cleveland’s murder rate is 7x greater the national average.
As of November 5, 2021, there have been 152 homicides reported and is a slight decrease year over year from 2020.
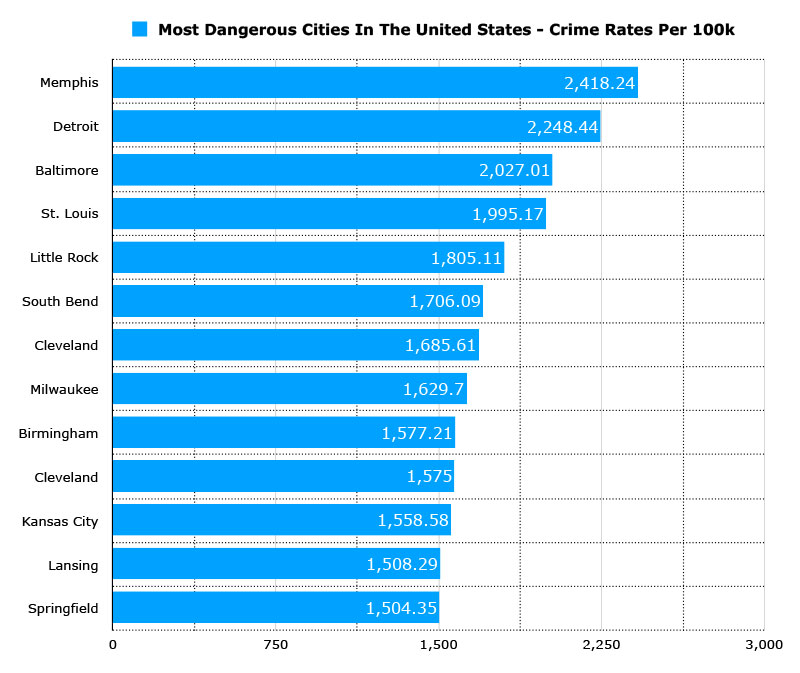
Cleveland vs The Most Dangerous Cities In The United States
Here’s a list of the top 11 most dangerous cities in the United States ranked by violent crime rates. Cleveland ranks 10th on most dangerous cities in the United States.
What do residents of Cleveland say about its safety
"All the tourist attractions are pretty safe to visit. You aren’t going to be in high crime areas unless you seek them out."
"The vast majority of the west side is relatively safe. The east side is generally unsafe except for a few pockets that are nice."
" Don’t stop in east Cleveland."
"Don’t slow down in East Cleveland or you’ll die!"
"I don’t think anyone would ever use “East Cleveland” and “positive” in the same sentence unless the sentence was ” I’m positive that I never want to live there”. "
"The worst neighborhoods in the city are on the East Side"
"In East Cleveland, you can literally own a house for less than $10,000, granted it will be a complete shithole and in a desolate area, but you would own your own house!"
"The stuff worth seeing in Cleveland for a tourist is pretty safe."
"Most of the east side is very poverty stricken and crime ridden."
"The west side is definitely safer than east side."
"Do not even think about going to East Cleveland, it is a dangerous city. "
Tips to stay safe while visiting Cleveland
Do you research before you travel. Know which part of the city to avoid. Don’t go to the places you should avoid.
Plan out your trips before you leave. Know exactly where your hotel is and know how to get back to your hotel.
Don’t walk around alone at night. Use an Uber or Taxi to get to your destination.
Don’t flash your wealth. Whether it be expensive watches, jewelry, purses, etc.
Avoid giving out contact or accommodation information to strangers.
Save the sightseeing for the daytime.
Don’t carry a lot of cash around and especially don’t flash your cash.
Walk with confidence and purpose, even if you are slightly unaware of where you are going.
Don’t look like a tourist.
Don’t engage with people trying to stop you on the street. Just keep walking.
Is Cleveland safe at night? / Is it safe to visit alone?
Cleveland can be a safer place to visit if you study the layout of the city and avoid the problem areas and also follow the safety tips posted above. Safety is never guaranteed in a high crime city.
Is Downtown Cleveland Safe?
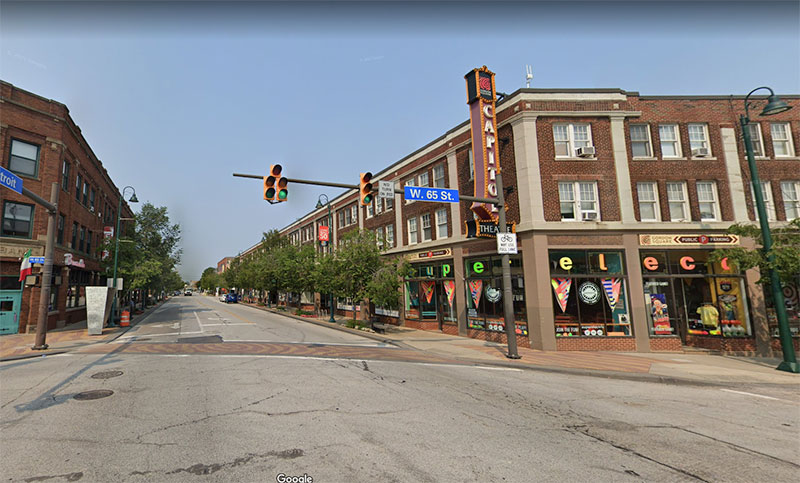
The main downtown area is pretty safe, especially during the day time. However, the further away from downtown you go, the sketchier it gets.
We recommend that you stay within the vicinity of the main downtown area and avoid wandering outside that area.
Final Thoughts
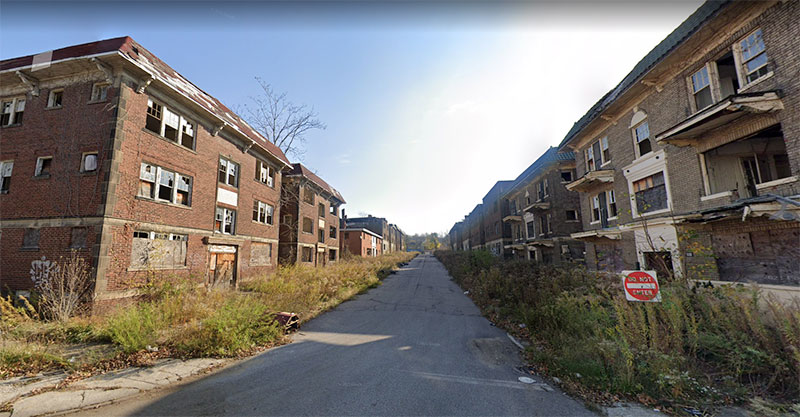
Statistically speaking, Cleveland is not a safe place to visit. It consistently ranks high on lists regarding violent crime and murder rates. Most of the east side of Cleveland should be avoided, except for a few small pockets and East Cleveland is a dystopian wasteland.
If you are traveling to Cleveland we recommend that you find accommodations on the west side of the city and in the areas mentioned above. You should also, at minimum, research the layout of the city and orient yourself with which places you should avoid.
Quick Facts About Cleveland
Cleveland, Ohio
United States
Population, percent change – April 1, 2010 (estimates base) to July 1, 2019, (V2019)
-3.9%
6.3%
Population, Census, April 1, 2020
372,624
331,449,281
Population, Census, April 1, 2010
396,815
308,745,538
Black or African American alone, percent
48.8%
13.4%
American Indian and Alaska Native alone, percent
0.5%
1.3%
Asian alone, percent
2.6%
5.9%
Native Hawaiian and Other Pacific Islander alone, percent
0.1%
0.2%
Two or More Races, percent
4.4%
2.8%
Hispanic or Latino, percent
11.9%
18.5%
White alone, not Hispanic or Latino, percent
33.8%
60.1%
Foreign born persons, percent, 2015-2019
5.9%
13.6%
Median value of owner-occupied housing units, 2015-2019
$69,600.00
$217,500.00
Median selected monthly owner costs -with a mortgage, 2015-2019
$998.00
$1,595.00
Median gross rent, 2015-2019
$719.00
$1,062.00
Language other than English spoken at home, percent of persons age 5 years+, 2015-2019
14.7%
21.6%
High school graduate or higher, percent of persons age 25 years+, 2015-2019
80.8%
88.0%
Bachelor’s degree or higher, percent of persons age 25 years+, 2015-2019
17.5%
32.1%
In civilian labor force, total, percent of population age 16 years+, 2015-2019
59.1%
63.0%
Total accommodation and food services sales, 2012 ($1,000)
950,855
708,138,598
Median household income (in 2019 dollars), 2015-2019
$30,907.00
$62,843.00
Per capita income in past 12 months (in 2019 dollars), 2015-2019
")
")

")
")
")
")

")
Leave a Reply