If you are thinking about visiting Little Rock and have some qualms about the safety of the city, we got you covered.
We are going to deep dive into the statistics, look at some maps, graphs and talk to the residents of the city to give you a better understanding of how safe Little Rock really is.
Is Little Rock, Arkansas Safe?
Statistically speaking, Little Rock is not the safest place. In 2021, Little Rock had one of the highest crime rates in the country, 2,095.94 per 100,000 people. Little Rocks’s crime rate is on par with cities like Detroit, St. Louis and Memphis.
Here’s a chart that will give you some perspective on Little Rock’s crime rate
Little Rock, Arkansas Crime Stats
Here’s a breakdown of all the crimes in the city for 2021 compared to 2020:
In 2021 Little Rock reported 4,091 violent crimes and had a violent crime rate of 2,095.94 per 100,000 people.
Year over year violent crime has increased by 12%.
You have a 1 in 48 chance of becoming a victim of violent crime in Little Rock.
Here’s a map showing you how violent crime has trended in Little Rock over a 12 year period.
*Violent crimes include; homicides, rape, robbery and aggravated assaults and the violent crime rate is calculated by dividing the number of reported crimes by the total population; the result is multiplied by 100,000.
Little Rock’s Property Crime Stats
In 2021 Little Rock reported 10,708 property crimes and had a property crime rate of 5,486.02 per 100,000 people.
Year over year property crime in Little Rock has increased by 11%.
You have a 1 in 8 chance of becoming a victim of property crime in Little Rock.
*Property crimes include; burglary, larceny-theft, motor vehicle theft, and arson and property crime rate is calculated by dividing the number of reported crimes by the total population; the result is multiplied by 100,000.
Little Rock’s Murder Stats
In 2021, Little Rock reported 62 homicide and had a homicide rate of 31.76 per 100,000 people.
In 2020, Little Rock reported 49 homicides, which is a 27% increase.
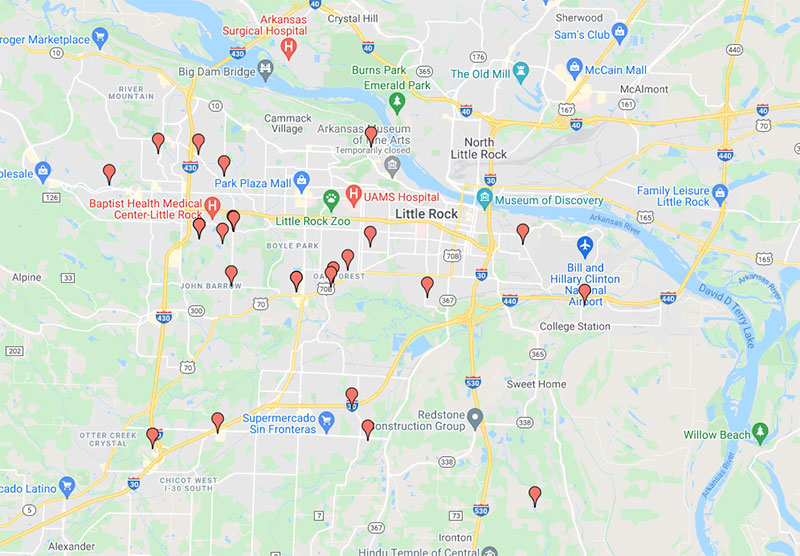
Here’s a map showing you the locations of all the murders in the city of Little Rock from 01/01/2021 – 01/01/2022
Little Rock vs The Rest Of Arkansas (2020)
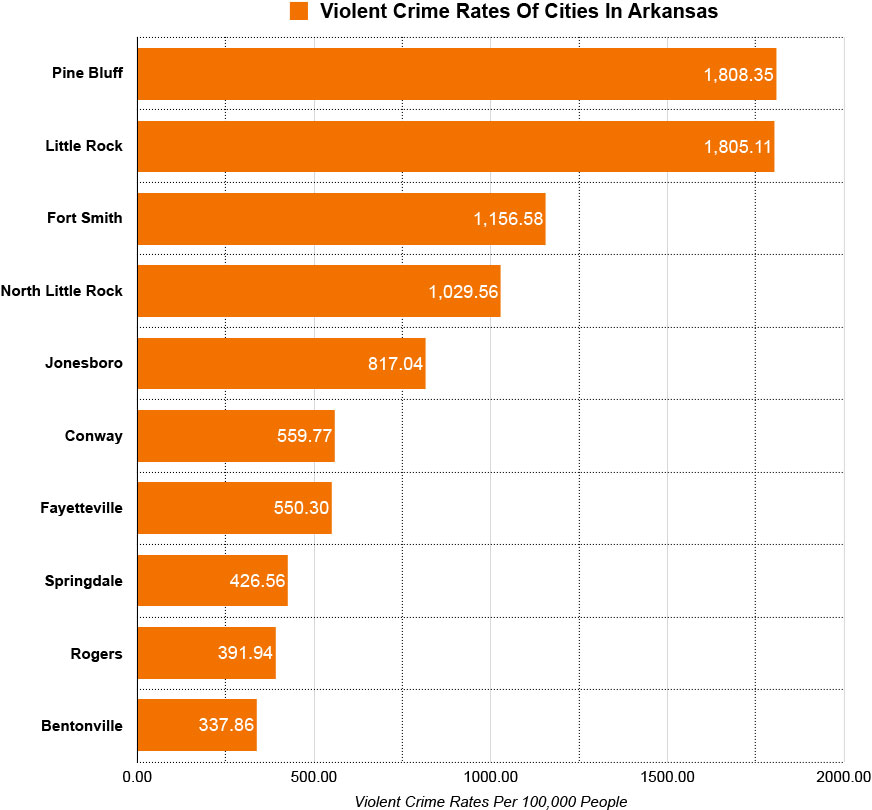
Here’s a graph showing you the violent crime rates of the 10 most populous cities in Arkansas. Little Rock’s violent crime rate ranked 2nd highest behind Pine Bluff.
Population
Violent Crime Rates
Pine Bluff
41,253
1808.35
Little Rock
202,591
1805.11
Fort Smith
89,142
1156.58
North Little Rock
64,591
1029.56
Jonesboro
78,576
817.04
Conway
64,134
559.77
Fayetteville
93,949
550.30
Springdale
84,161
426.56
Rogers
69,908
391.94
Bentonville
54,164
337.86
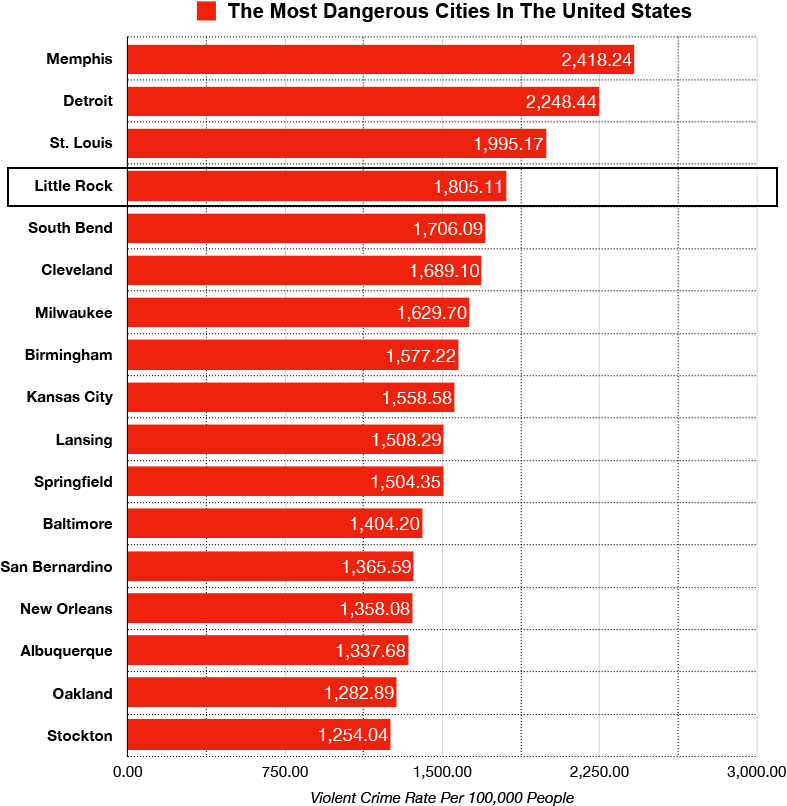
Little Rock, Arkansas vs The Most Dangerous Cities in the United States (2020)
Here’s a list of the top 18 most dangerous cities in the United States ranked by violent crime rates. Little Rock’s violent crime rate ranks 4th highest.
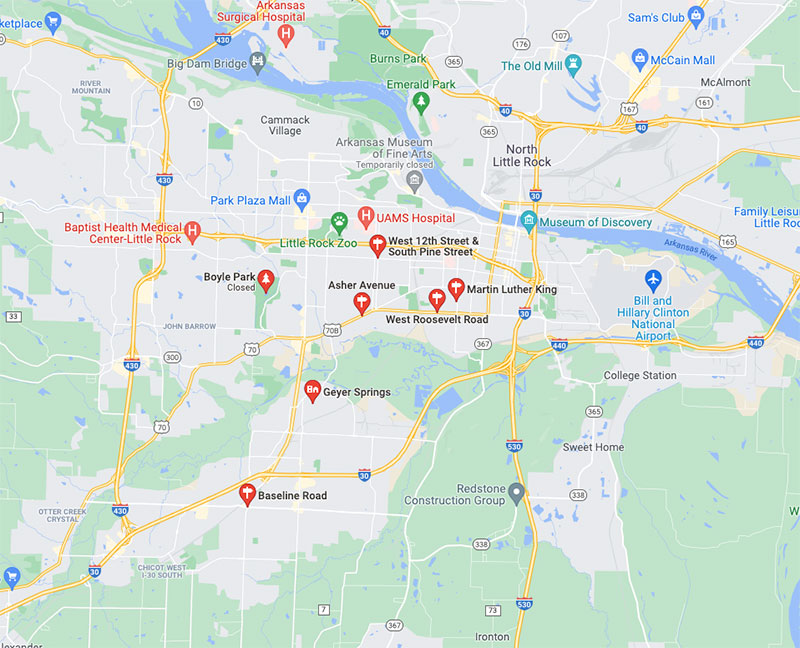
Most Dangerous Neighborhoods In Little Rock, Arkansas
South of I-630
Geyer Springs
Boyle Park
South of I 630 to Cedar, Mara Lynn Road, Boyle Park, West 25th
Roosevelt
Asher
12th and Pine
Battery
Martin Luther King
Baseline
Safest Neighborhoods in Little Rock, Arkansas
Heights
Hillcrest
Park Hill
Soma
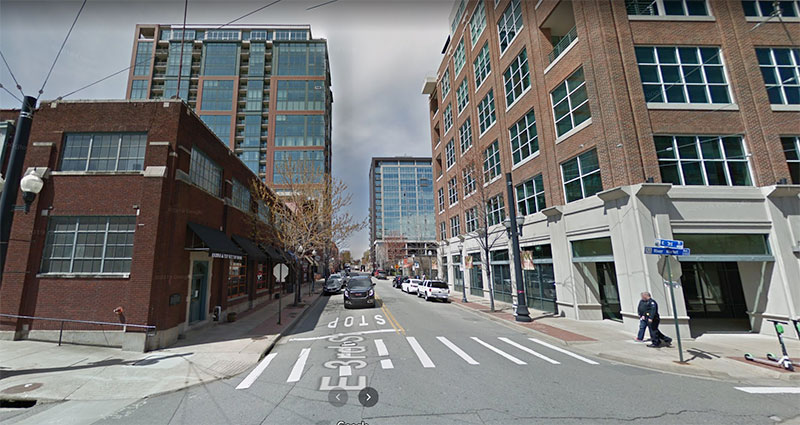
Is Downtown Little Rock, Arkansas Safe?
Downtown Little Rock is generally a safe area to visit and wander around during the day time.
At night you want to stick to the SoMa and River Market area and avoid straying away too far from those areas.
What do residents of Little Rock say about it’s safety?
"Little Rock has a crime problem, but much of it is localized and in places a tourist would not want to go."
"Here’s a good rule of thumb for Little Rock, don’t go south of I-630 at night."
"Avoid south Little Rock and eastern Little Rock, just over the I30 bridge. Those areas are sketchy."
"Numbers don’t lie. However, I don’t feel unsafe in this town."
"Generally north of 630 is good. West of 430 is also pretty safe. South of 630 is not very safe."
"I don’t think Little Rock is safe. Crime seems to be everywhere. I lived in West Little Rock for a couple years. I’ve been mugged personally and multiple friends have been robbed at gunpoint."
"I know people love this city, but I don’t even really feel at safe going anywhere at night, or anywhere unfamiliar in Little Rock."
"The farther north and west you can get in Little Rock the safer you will be."
"West Little Rock, north of Chenal is the safest part of the city."
"Little Rock is like any other city. There are places you shouldn’t venture out to at night. It’s not like the Bangin’ In The Rock days anymore."
"Avoid going south of 630. North of 630 Is generally good, but there are some bad pockets."
"South of 630 is bad, but it gets better the closer you get to downtown."
"I’ve lived in Little Rock for more than 5 decades and never had any real problems. I know the statistics speak differently but most of the crime is concentrated certain parts of the city and is relegated l to people who are involved in illicit activities."
Is Little Rock safe for women?
While there are no guarantees, Little Rock is generally safe for female solo travelers IF you learn the layout of the city, avoid problem areas, stay in well lit/well populated areas and avoid walking by yourself at night.
Is it safe to walk around Little Rock, Arkansas?
Little Rock is safe to walk around during the daytime, however we recommend that you avoid walking around in the dangerous neighborhoods mentioned above altogether.
At night the situations changes and Little Rock is not particularly safe. If you stick to Downtown (River Market area), SoMa, Heights, Park Hill and Hillcrest and follow the safety tips posted below, you should be able to mitigate your chances of being a victim.
Is Little Rock’s tap water safe to drink?
The tap water in Little Rock, Arkansas is generally safe to drink.
While the tap water in Little Rock meets the EPA health guidelines, it can still contain contaminants present in trace amounts that could potentially cause health issues over the long-run.
If you have any concerns about the tap water in Little Rock, we suggest that you use bottle water for your drinking needs.
Tips to stay safe while visiting Little Rock, Arkansas
Do your research BEFORE you visit. Research the areas you want to stay and visit and see if those areas are high crime areas.
Know where you’re going and at what time. Some areas of Little Rock you can visit during the day time with no problems, but at night time that changes.
Don’t keep valuables in your car or in plain sight in your car.
Don’t walk alone by yourself at night. Get an Uber or Lyft.
Always be aware of your surroundings. Don’t walk down the street scrolling through your phone and have your headphones glued into your ears.
Stay in well populated and well lit areas at night. Avoid going down alleys or desolate streets.
Travel in groups at night, especially if you’ve been drinking.
Be smart about where you’re parking, especially if you’re going to be leaving late.
Don’t drink in excess and be careful drinking on your own or with people you don’t know.
Trust your instincts and your gut feeling. If you don’t feel safe, if something feels wrong, don’t do it, don’t go, remove yourself from the situation.
A Few Things You Should Do While Visiting Little Rock According To Locals
The Root Cafe – The biscuits and gravy here will change your damn life.
The Pantry – Everything on the menu is great, and the atmosphere is tough to beat. Their cheesecake is off the charts too.


")
")
")

")
")
")
")
")
Leave a Reply