It’s difficult to imagine a place with more to offer than New York City. Culture, art, diversity, restaurants, music, sports, museums, shopping, all in 5 boroughs, spread throughout 302sq miles and with over 8.4 million inhabitants, there are endless possibility of experiences.
And to top it off they say New York City is the safest big city in the United States, but how true is that?
We are going to deep dive into the statistics, look at some maps, graphs and talk to the residents of the city to give you a better understanding of how safe the city really is.
Is New York City Safe?
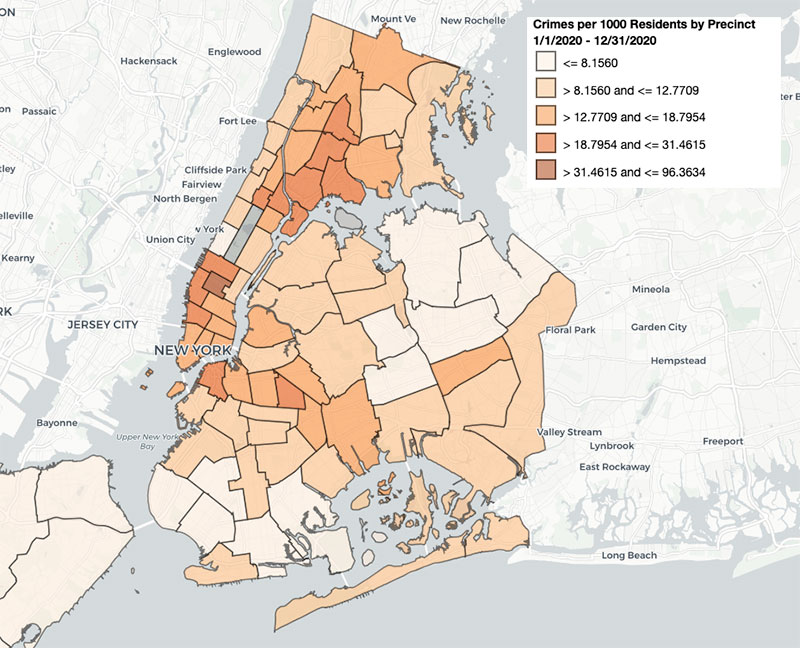
Looking at the crime statistics, New York City is a very safe place to visit. It is one of the safest cities in the United States. In 2020, New York City had a violent crime rate of 404.03 per 100,000 people. Out of the 100 most populous cities in the United States, New York City’s violent crime rate ranked 74th. Austin, San Jose And El Paso all have similar crime rates as New York City.
The population for the New York City in 2020 is 8,804,190
New York City Crime Stats
Here’s a breakdown of all the crimes in New York City for 2020. We also included the crimes stats 1990 and 2001 to give you some perspective on how crime has evolved in New York City over the years:
1990
2001
2020
’20 vs ’90
Murder
2,262
649
468
-79.3%
Rape
3,126
1,930
1,427
-54.4%
Robbery
100,280
27,873
13,108
-86.9%
Felony Assault
44,122
23,020
20,569
-53.4%
Burglary
122,055
32,694
15,478
-87.3%
Grand Larceny
108,487
46,291
35,502
-67.3%
Grand Larceny Auto
146,925
29,607
9,037
-93.8%
TOTAL
527,257
162,064
95,589
-81.9%
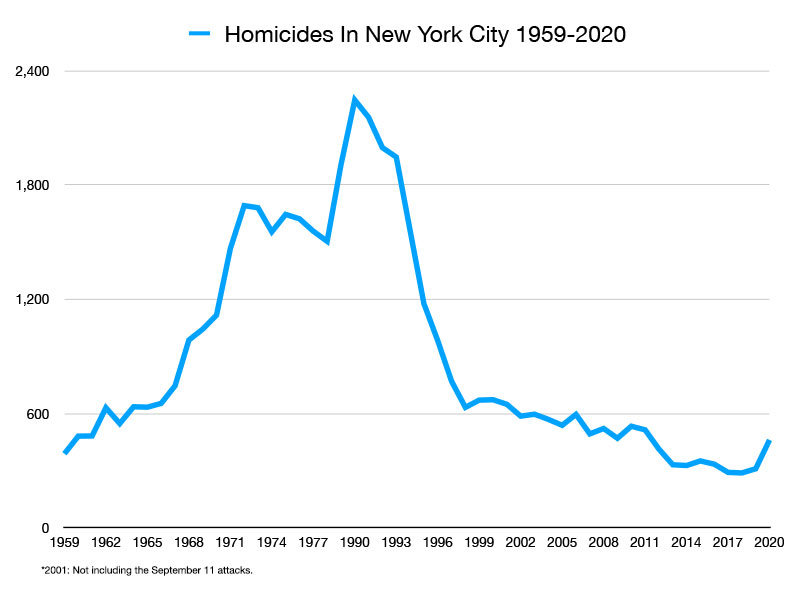
Looking at the chart, you can see that crime in New York City has significantly decreased over a 30 year time period. Total crime has decreased 81.9% from 1990!
In 2020 New York City reported 35,572 violent crimes and had a violent crime rate of 404.03 per 100,000 people. The national average for violent crime is 366.7 per 100,000 residents. New York City’s violent crime rate is 18% lower than the national average.
In 1990 New York City reported 149,790 violent crimes and had a violent crime rate of 2,045.59 per 100,000 people.
New York City’ violent crime rate has decreased 80.2% in the 30 year time frame.
**Violent crimes include; homicides, rape, robbery and aggravated assaults and the violent crime rate is calculated by dividing the number of reported crimes by the total population; the result is multiplied by 100,000.
New York City Murder Stats
In 2020 New York City reported 468 homicides, which gives it a murder rate of 5.31 per 100,000 residents. The national murder rate is 5 per 100,000 people. New York City’s murder rate is slightly higher than the national average.
468 homicides was a 46.7% increase over 2019 where 319 homicides were reported. New York City also saw a 97% increase (1,531 v. 777) in shooting incidents.
New York City vs The Most Dangerous Cities In The United States
Here’s a list of the top 10 most dangerous cities in the United States ranked by violent crime rate. It can give you some perspective on New York City’s violent crime rate, which is 404.03 per 100,000 people.
New York City’s violent crime rate is nearly 6 times LESS than Memphis, the most dangerous city on the list.
What do residents of New York City say about its safety
"If you’re imagining the New York of the 70’s – 90’s, that city no longer exists. Crime is historically low in the city. It’s not that lawless city, where gangs fight in the streets with reckless abandon."
"I feel safe walking in almost any part of Manhattan at almost any hour of the day."
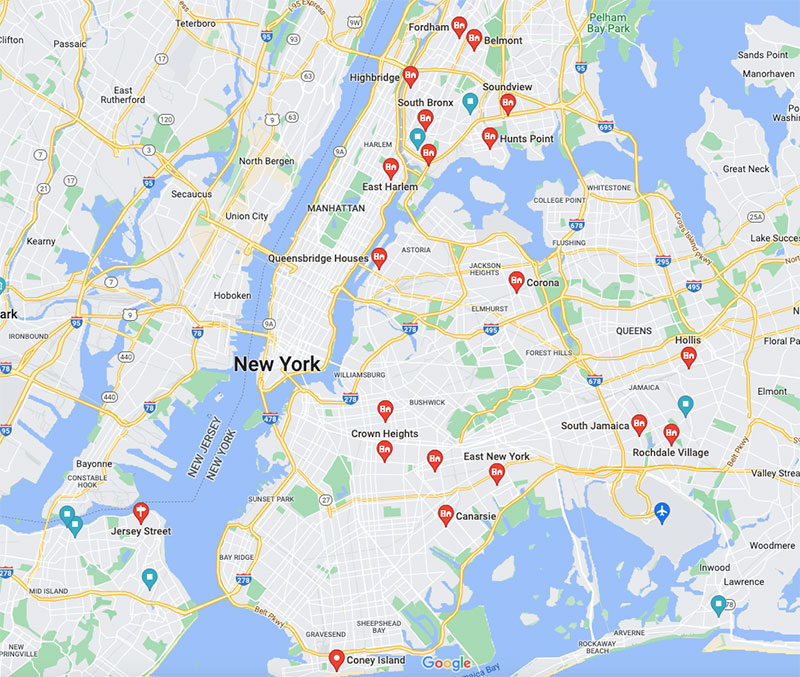
"New York City is fairly safe. You still need to avoid certain areas like Brownsville, East New York, Bed-Stuy, Canarsie, South Bronx, etc."
"For it size, New York City is quite safe. In most of the touristy areas there is a lot of police presence."
"It’s not some lawless dystopia that some media outlets are portraying it. Crime is up compared to the last few years, but it is far safer today than it has been in the 70s, 80s, and 90s."
"New York is safe, but there is nowhere in the world where the safety is 100% guaranteed."
"For the most part NY is safe to visit. Just figure out which areas you should avoid. Don’t be hanging out in South Bronx or Brownsville in the middle of the night with your Sony camera hanging around your neck."
"The news blows crime way out of proportion and makes the average person think it is much worse than it is. It’s not that bad, and you’ll be fine. the odds of something happening to you are still tiny."
"Crime has increased since last year, thanks to the mayor’s reluctance to jail criminals."
"If you just keep your wits about you and don’t act like a total clown you should be fine."
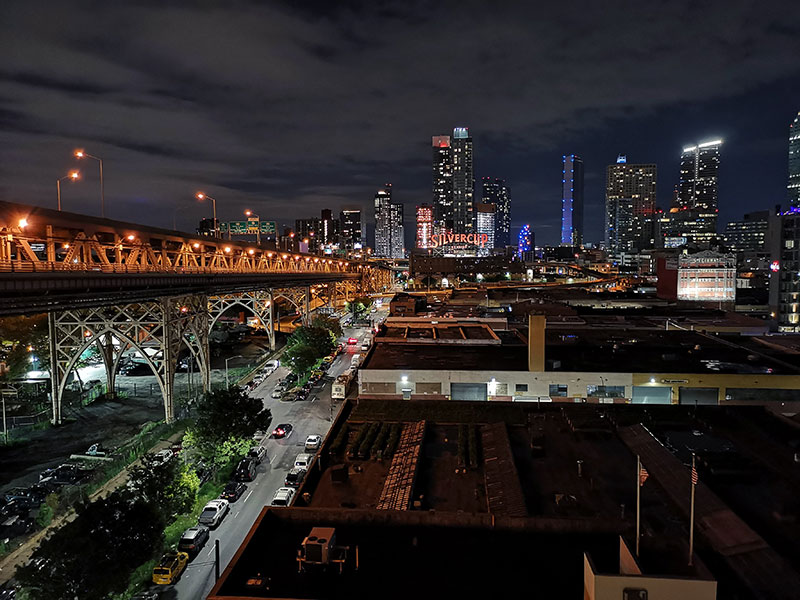
Is New York City safe at night?
New York City is safe at night if you avoid going into the dangerous areas mentioned above, as well as the parks.
Is it safe to visit alone?
New York City is a safe place to visit alone. You can mitigate your chances of becoming a victim if you learn the layout of the city, avoid the sketchy areas and follow the safety tips posted below.
Tips To Stay Safe In New York City
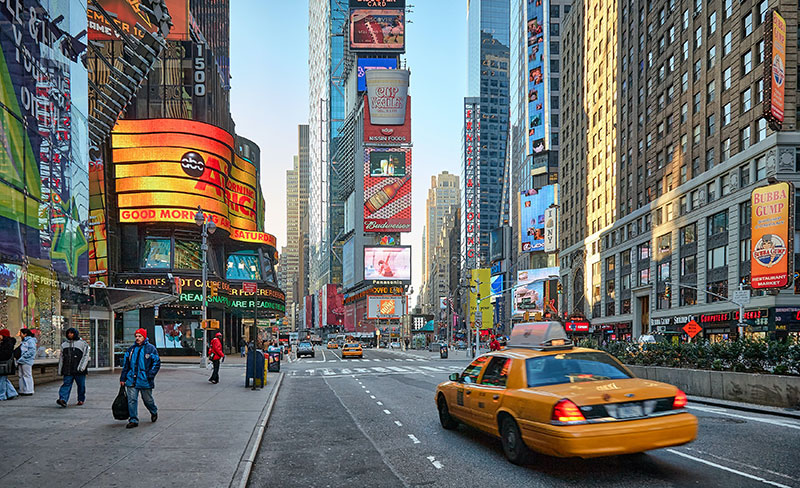
Don’t put your wallet or your phone in your back pocket, especially in a touristy area like Time Square.
If you get on a subway, get in a car that has people in it. Avoid the empty cars.
If you do take the subway at night, get in the center car with the conductor.
Don’t take the subway late at night. Take an Uber or cab instead.
Don’t walk through Central Park in the middle of the night or any park for that matter.
Study your routes before you leave your hotel. Know exactly how to get there and how to get back.
Stay away from extremely crowded streets, as there’s a danger of pickpockets.
Stay alert of your surroundings. Don’t walk around with your phone in your hands while texting and listening to music.
Don’t feel the need to be police if you feel uncomfortable. Switch subway cars, go to the other end of the platform, walk acorss to the other side of the street.
Don’t engage with people trying to stop you on the street. Keep walking and ignore them.
Don’t accept anything from anyone trying to give you something free on the street.
Stand far away from the edge of the subway platform.
Someone who approaches you with a sob story is probably trying to swindle you of money.
Don’t look at a crazy people in the eye and definitely don’t stare. Avoid them and keep walking and they will leave you alone.
If someone is following you, go into a shop or find a crowded area.
How did New York City manage to become one of the safest major cities in the country?
This is a massive question with a lot of different variables involved.
First you need to realize that crime was higher everywhere in the US in the 70s, 80s and 90s and it wasn’t just New York City. Crime rates across the country rose.
While no one can point to one exact reason why, there are competing theories on how NYC manage to significantly lower its crime rate over the past 30 years.
Broken-Windows policing
The basic idea of Broken Windows theory is that you can help reduce serious crime by keeping neighborhoods clean. By maintaining and monitoring urban areas to prevent small crimes, such as vandalism, creates an atmosphere of lawfulness, thus preventing more serious crimes.
Gentrification
Most petty crime and violent crime, is committed by poor people. When they no longer live here there will be less crime. Criminals couldn’t afford to live here anymore because they were being pushed out of their neighborhoods.
Lead-crime hypothesis
This theory proposed there was a link between lead exposure and increases in violent crime later in life. When leaded gasoline was still being used and lead paint was more common, kids had higher blood lead levels.
Abortion theory
This hypothesis suggested that legalized abortion led to less unwanted children in low-income families, which led to less people predisposed to committing crimes. After Roe vs Wade in 1972, crime rates began dropping at the same time people born after this year would be reaching adulthood.
There are countless other theories that you can read up on here.
Final Thoughts
New York City is a very safe place to visit. It’s crime stats are historically low and although though homicides have increased in the past two years, they are still low relatively low compared to other cities.
There are 8.5 million people living in New York City with 468 homicides in 2020. Compare that to other American cities:
Chicago: 771 homicides, ~2.7m residents
Baltimore: 335 homicides, ~585k residents
Memphis: 334 homicides, ~651k residents
Crime may be up in NYC the past few years, but it has a long way to go to be even remotely called ‘unsafe’.
As long as you learn the layout of the city, avoid the places mentioned above, keep your wits about you and follow the safety tips posted above, you can greatly reduces your chaces of becoming a victim.
Quick Facts About New York City
Fact
New York city, New York
United States
Population, Census, April 1, 2010
8,175,133
308,745,538
Population, Census, April 1, 2020
8,804,190
331,449,281
White alone, percent
42.7%
76.3%
Black or African American alone, percent
24.3%
13.4%
American Indian and Alaska Native alone, percent
0.4%
1.3%
Asian alone, percent
14.1%
5.9%
Hispanic or Latino, percent
29.1%
18.5%
Foreign born persons, percent, 2015-2019
36.8%
13.6%
Median value of owner-occupied housing units, 2015-2019
$606,000.00
$217,500.00
Median selected monthly owner costs -with a mortgage, 2015-2019
$2,730.00
$1,595.00
Median selected monthly owner costs -without a mortgage, 2015-2019
$903.00
$500.00
Median gross rent, 2015-2019
$1,443.00
$1,062.00
Households, 2015-2019
3,167,034
120,756,048
High school graduate or higher, percent of persons age 25 years+, 2015-2019
82.2%
88.0%
Bachelor’s degree or higher, percent of persons age 25 years+, 2015-2019
38.1%
32.1%
In civilian labor force, total, percent of population age 16 years+, 2015-2019
63.6%
63.0%
Median household income (in 2019 dollars), 2015-2019
$63,998.00
$62,843.00
Per capita income in past 12 months (in 2019 dollars), 2015-2019

")
")
")
")
")


")
Leave a Reply