If you are thinking about visiting Hoboken and have some qualms about the safety of the city, we got you covered.
We are going to deep dive into the statistics, look at some maps, graphs and talk to the residents of the city to give you a better understanding of how safe Hoboken really is.
Is Hoboken, New Jersey Safe To Visit?
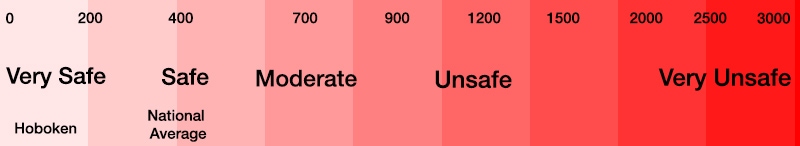
Statistically speaking, Hoboken is very safe place to visit. Hoboken’s crime rates are one of the lowest in the nation. In 2020, Hoboken had a violent crime rate of 109.24 per 100,000 people. It’s violent crime rate is 73% less than the national average and it’s property crime rate of 1,281.05 per 100,000 people is 35% less than the national average.
Here’s a scale to give you some perspective on Hoboken’s violent crime rate:
Hoboken, NJ Crime Stats
Here’s a breakdown of all the crimes in the city for 2020 compared to 2019:
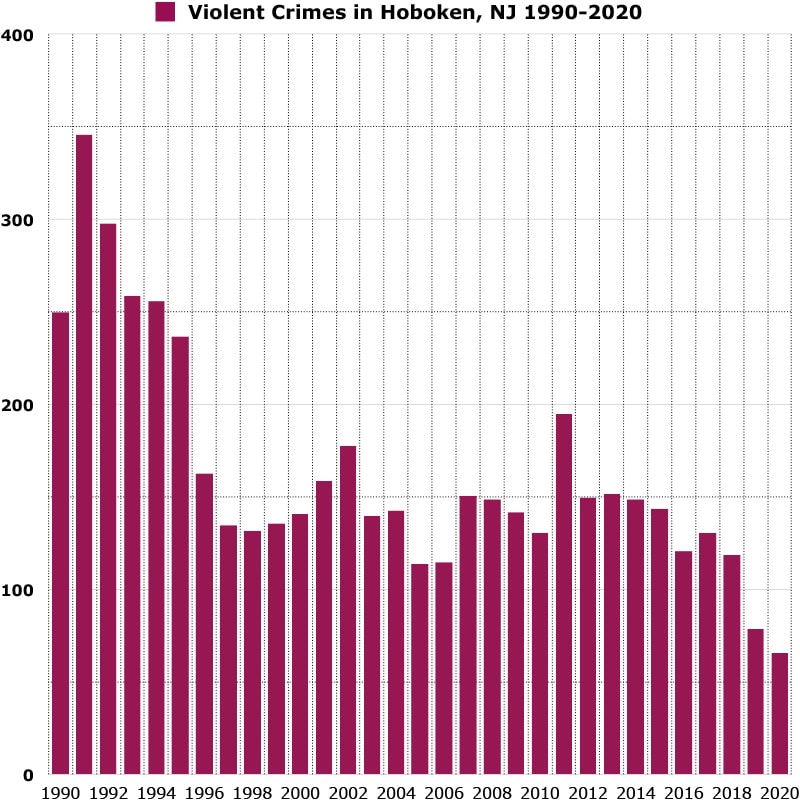
In 2020 Hoboken reported 66 violent crimes and had a violent crime rate of 109.24 per 100,000 people.
Year over year violent crime has decreased by 16%.
It’s violent crime rate is on par with cities like Irvine, Scottsdale and Virginia Beach.
Violent crime is at it’s lowest level in 30 years.
Here’s a map showing you how violent crime has trended in Hoboken over a 30 year period.
*Violent crimes include; homicides, rape, robbery and aggravated assaults and the violent crime rate is calculated by dividing the number of reported crimes by the total population; the result is multiplied by 100,000.
Hoboken’s Murder Rate
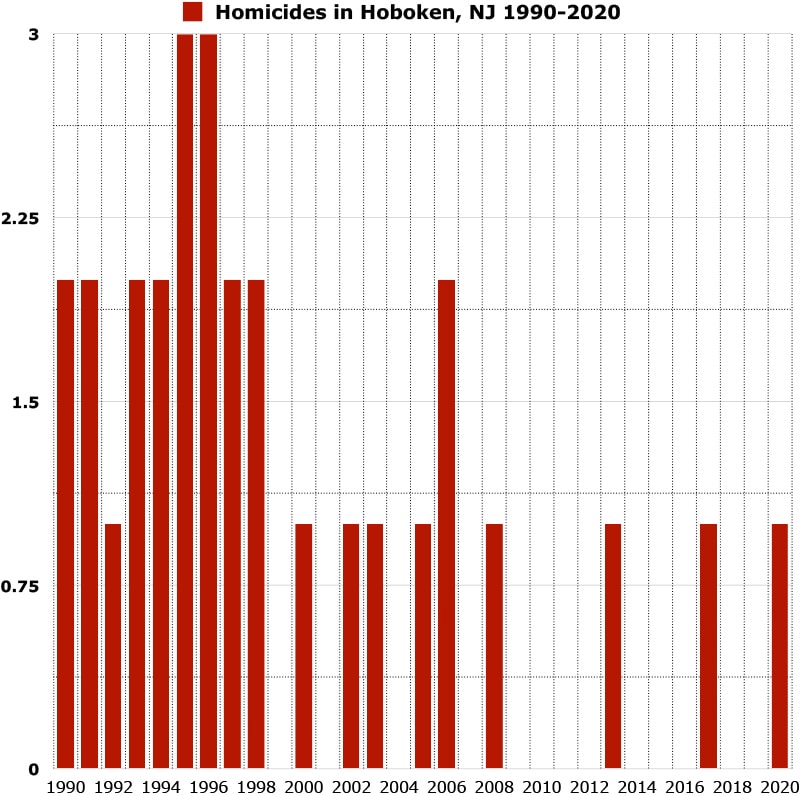
In 2020, Hoboken reported 1 homicides and had a homicide rate of 1.66 per 100,000 people.
Hoboken’s homicide rate is roughly 75% less than the national average and 55% less than the state average.
Hoboken has a similar homicide rate to cities like Santa Clara, Boise and Fremont.
Here’s a map showing you how homicides has trended in Hoboken over a 30 year period.
Hoboken’s Property Crime Rate
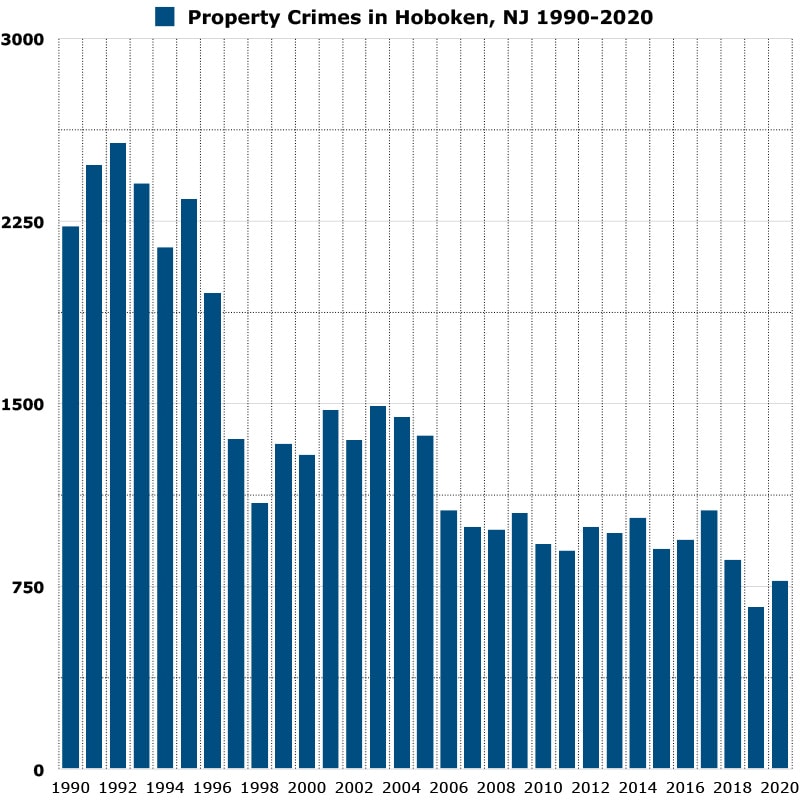
In 2020 Hoboken reported 774 property crimes and had a property crime rate of 1,281.05 per 100,000 people.
The national average for property crime is 1958.2 per 100,000 residents. Hoboken’s property crime rate is 35% less than the national average.
Hoboken’s property crime rate is roughly 11% greater than the state average.
Year over year property crime in Hoboken has increased by 14%.
Hoboken property crime rate is similar to Irvine, Santa Clara and Gilbert.
Property crime is near its lowest level in 30 years.
Here’s a map showing you how property crime has trended in Hoboken over a 30 year period.
*Property crimes include; burglary, larceny-theft, motor vehicle theft, and arson and property crime rate is calculated by dividing the number of reported crimes by the total population; the result is multiplied by 100,000.
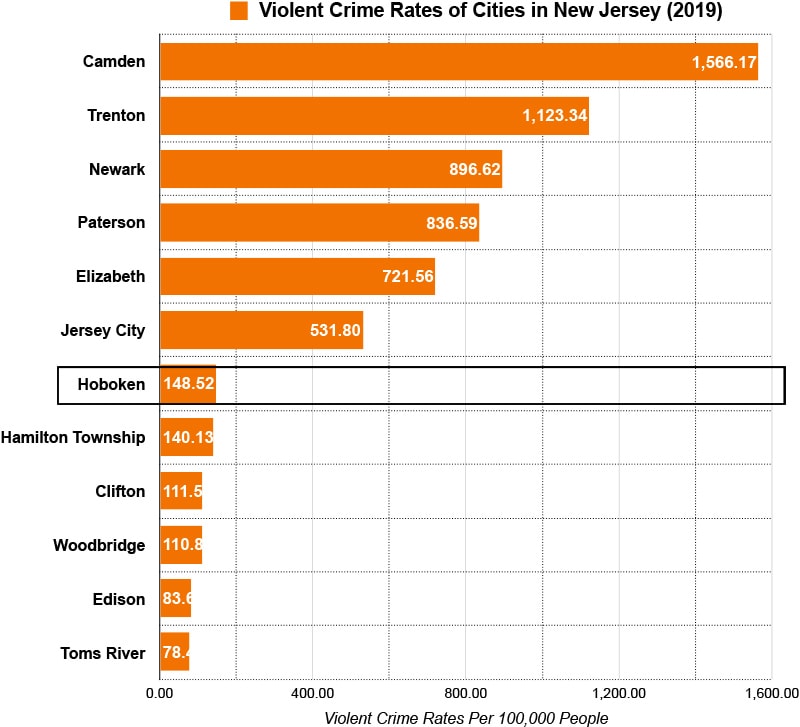
Hoboken vs Other Cities In New Jersey
Here’s a graph showing you the violent crime rates of the 11 most populous cities in New Jersey. Hoboken’s violent crime rate ranked 7th among all cities
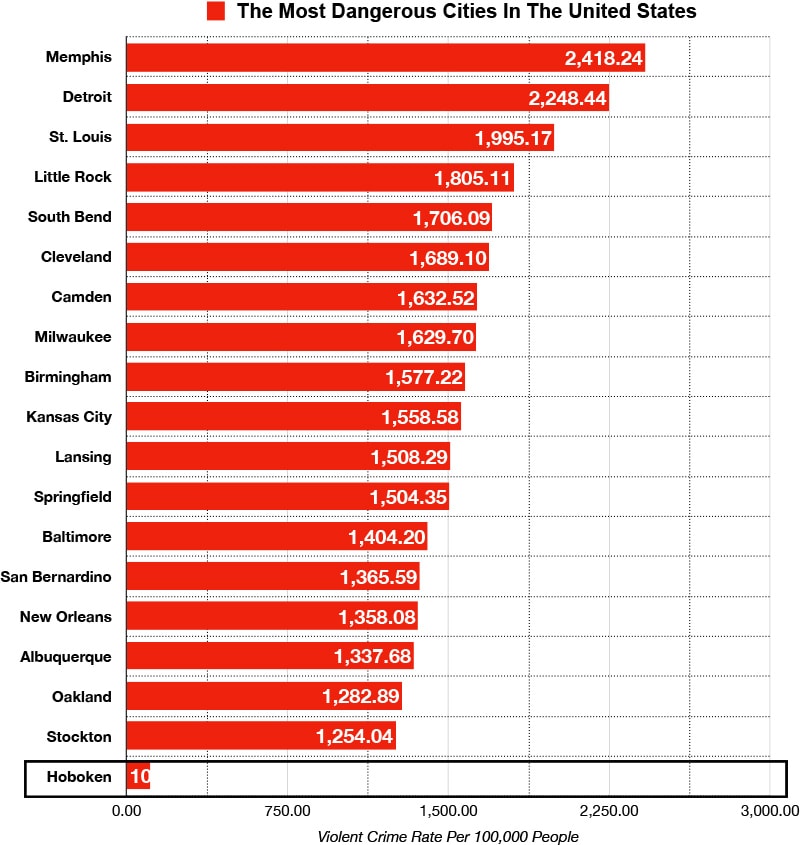
Hoboken, New Jersey vs The Most Dangerous Cities in the United States
Here’s a list of the top 19 most dangerous cities in the United States ranked by violent crime rates. Hoboken’s violent crime rate is 22x less than Memphis, the most dangerous city on the list.
The public transportation system in Hoboken is handled by PATH and it offers many routes that interweave throughout the entire city and into Manhattan. However, we do not recommend that you take PATH late at night. There’s a lot less people around and it can get sketchy down there. Get a taxi or an Lyft instead.
Download the PATH app to know the exact times of the trains.
What do residents of Hoboken say about it’s safety?
"Hoboken is a safe place, but like any city, one must exercise some common sense."
"I visit Hoboken regularly and I never felt unsafe. There is a homeless population, but for the most part they do not bother anyone."
"Hoboken is a very safe city. Your biggest concerns are stepping on dog poop and people running stop signs."
"Hoboken is the only “college” town where the college kids will call the police on the residents for getting too lout and partying too much."
"The area around 3rd and Jackson is a little sketchy but it’s not horrible."
"People running stop signs are probably the biggest threat to your safety in Hoboken."
"Hoboken is incredibly safe, just look at our crime rates. Uptown is more quiet family oriented and downtown is more of a party scene where younger people go out."
"You won’t have much to worry about anywhere as long as you’re not actively being a dummy."
"There are no real bad areas of hoboken. Some people will say 2nd to 6th being “sketchy”, but its just a housing project with people trying to live."
"Hoboken aka the ‘Urban Mr. Rogers Neighborhood’ is super safe, friendly, and convenient."
"There really isn’t really any bad neighborhoods or areas in Hoboken."
" Crime isn’t an issue in Hoboken, except for one small area Jackson St., from third to seventh."
Is Hoboken safe at night?
Hoboken is safe at night. You can mitigate your chances of being a victim of crime if you avoid the sketchy neighborhoods mentioned above and follow the safety tips below.
Tips to stay safe while visiting Hoboken, New Jersey
When waiting for the train, don’t stand too close to the platform. There have been instances of being pushed onto the tracks.
Ignore the panhandlers and don’t engage with the homeless. Just keep walking.
Always keep an eye on your belongings. Wear your purse across your body and keep your wallet in your front pocket.
Avoid taking the train late at night. If it’s unavoidable, go in the train with the conductor.
Leave your valuables at home. Avoid making yourself a walking advertisement.
Walking with confidence and purpose goes a long way in preventing people from targeting you.
Avoid desolate and or unlit areas at night. Also don’t walk through alleys.
When crossing an intersection, wait a second after the light turns green. People will often run red lights.
Quick Facts About Hoboken, New Jersey
Population, Census, April 1, 2020
60,419
331,449,281
Population, Census, April 1, 2010
50,005
308,745,538
Persons under 5 years, percent
6.5%
6.0%
Persons under 18 years, percent
13.9%
22.3%
Persons 65 years and over, percent
6.2%
16.5%
Black or African American alone, percent
3.4%
13.4%
American Indian and Alaska Native alone, percent
0.0%
1.3%
Asian alone, percent
9.8%
5.9%
Native Hawaiian and Other Pacific Islander alone, percent
0.0%
0.2%
Two or More Races, percent
3.9%
2.8%
Hispanic or Latino, percent
16.0%
18.5%
White alone, not Hispanic or Latino, percent
69.4%
60.1%
Foreign born persons, percent, 2015-2019
17.1%
13.6%
Median value of owner-occupied housing units, 2015-2019
$720,700.00
$217,500.00
Median selected monthly owner costs -with a mortgage, 2015-2019
$3,546.00
$1,595.00
Median gross rent, 2015-2019
$2,315.00
$1,062.00
High school graduate or higher, percent of persons age 25 years+, 2015-2019
95.6%
88.0%
Bachelor’s degree or higher, percent of persons age 25 years+, 2015-2019
80.5%
32.1%
In civilian labor force, total, percent of population age 16 years+, 2015-2019
80.0%
63.0%
Median household income (in 2019 dollars), 2015-2019
$147,620.00
$62,843.00
Per capita income in past 12 months (in 2019 dollars), 2015-2019
")
")
")
")
")
")
")
")
")
Leave a Reply