If you are thinking about visiting Tucson and have some qualms about the safety of the city, we got you covered.
We are going to deep dive into the statistics, look at some maps, graphs and talk to the residents of the city to give you a better understanding of how safe Tucson really is.
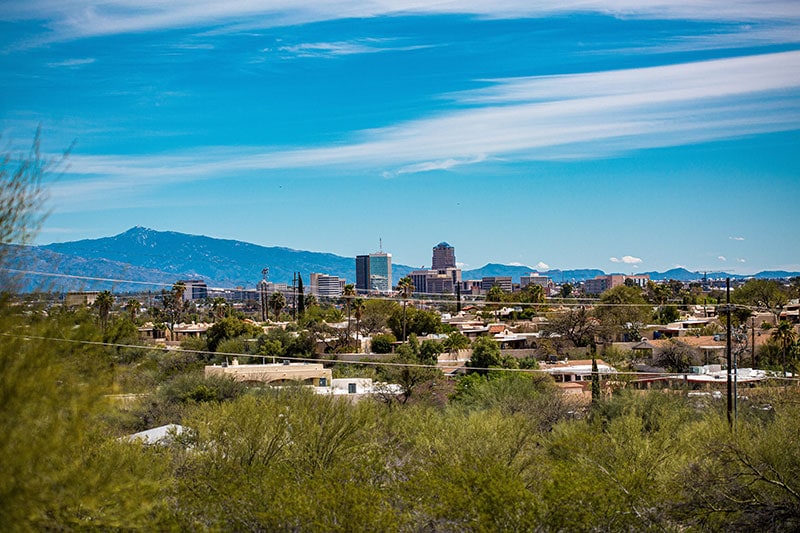
Is Tucson, Arizona Safe To Visit?
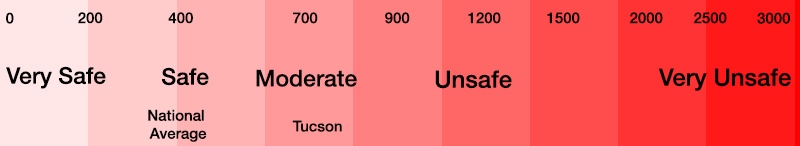
Statistically speaking, Tucson is moderately safe place to visit. In 2020, Tucson had a violent crime rate of 708.22 per 100,000 people. It’s violent crime rate is 1.8x greater than the national average and is similar to cities like Los Angeles, Atlanta and Dallas.
Here’s a scale to give you some perspective on Tucson’s violent crime rate:
Tucson, AZ Crime Stats
Here’s a breakdown of all the crimes in the city for 2020 compared to 2019:
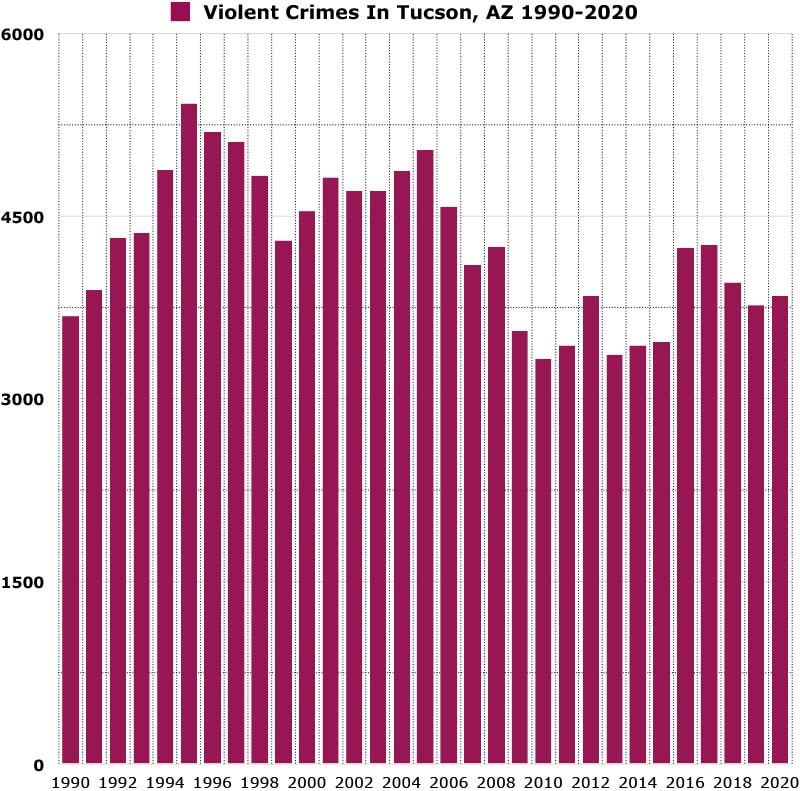
In 2020 Tucson reported 3,843 violent crimes and had a violent crime rate of 708.22 per 100,000 people.
Tucson’s violent crime rate is 1.5x greater than the state average
Year over year violent crime has increased by 2%.
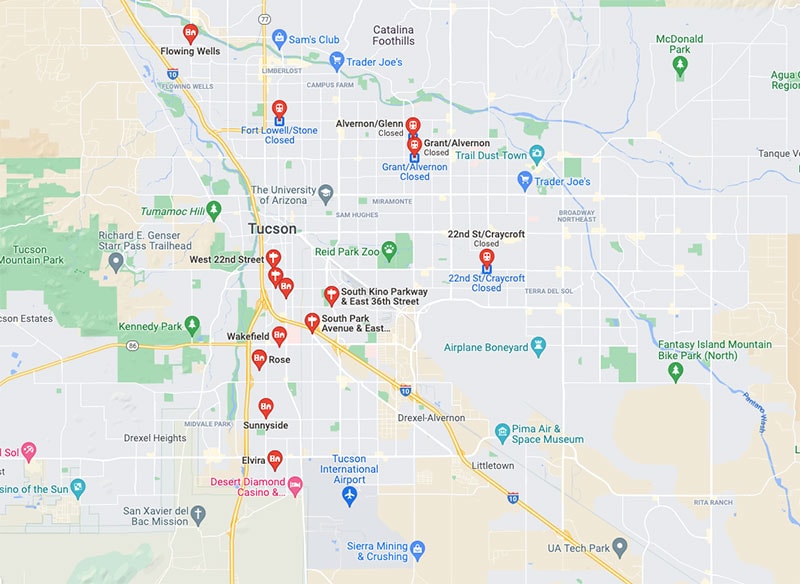
Here’s a map showing you how violent crime has trended in Tucson over a 30 year period.
*Violent crimes include; homicides, rape, robbery and aggravated assaults and the violent crime rate is calculated by dividing the number of reported crimes by the total population; the result is multiplied by 100,000.
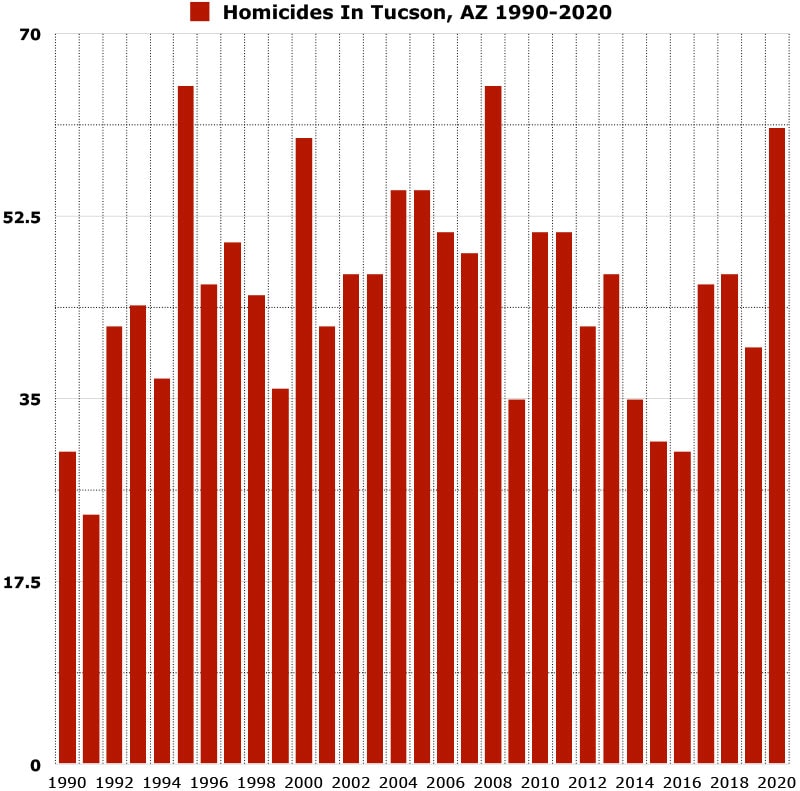
Tucson’s Murder Rate
In 2020, Tucson reported 61 homicides and had a homicide rate of 11.24 per 100,000 people.
Tucson’s homicide rate is roughly 1.7x greater than the national average and 1.6x greater than the state average.
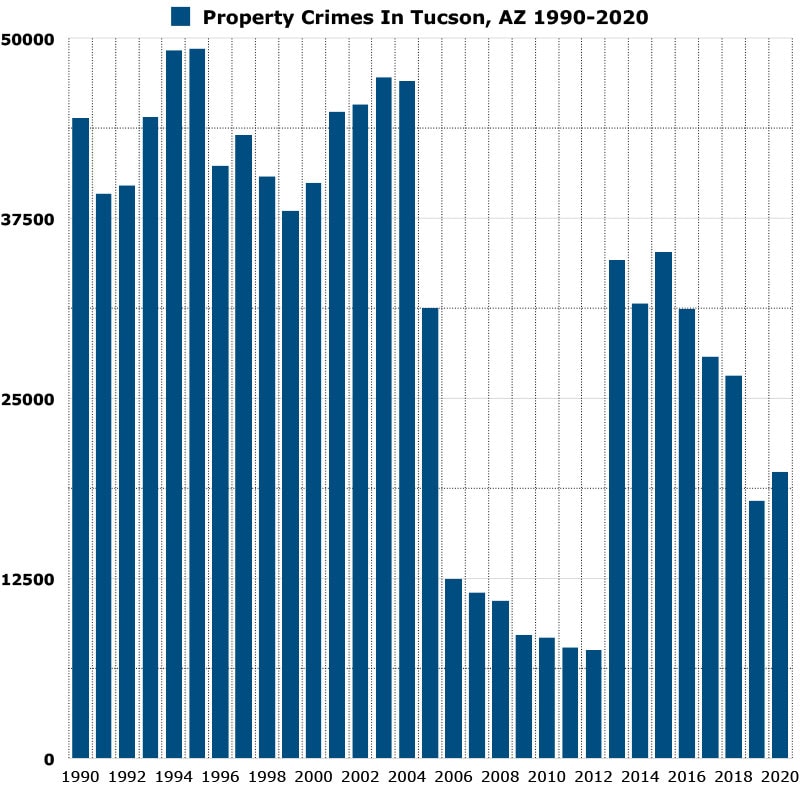
Here’s a map showing you how property crime has trended in Tucson over a 30 year period.
*Property crimes include; burglary, larceny-theft, motor vehicle theft, and arson and property crime rate is calculated by dividing the number of reported crimes by the total population; the result is multiplied by 100,000.
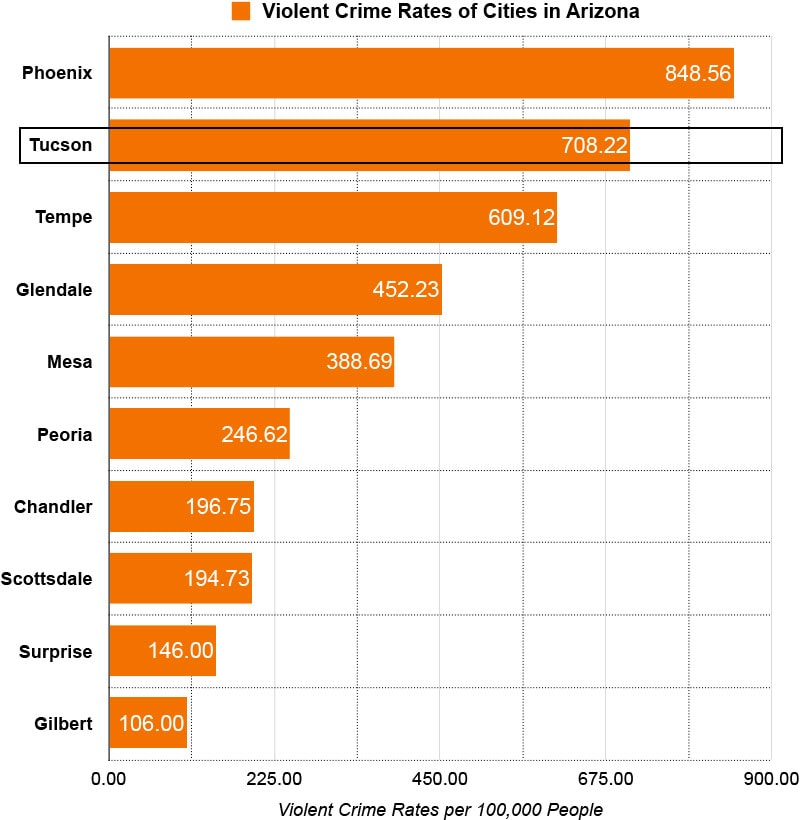
Tucson vs Other Cities In Arizona
Here’s a graph showing you the violent crime rates of the 10 most populous cities in Arizona. Tucson’s violent crime rate ranked 2nd highest among all cities
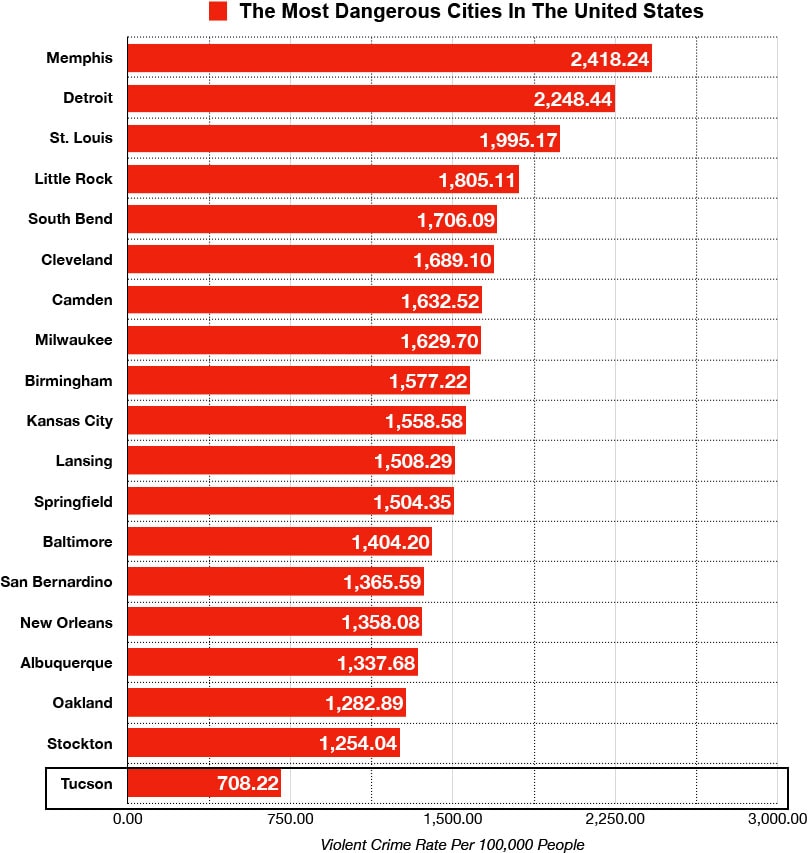
Tucson, Arizona vs The Most Dangerous Cities in the United States
Here’s a list of the top 19 most dangerous cities in the United States ranked by violent crime rates. Tucson’s violent crime rate is 3.4x less than Memphis, the most dangerous city on the list.
Downtown Tucson is generally safe to visit during the day time. At night we recommend that you take a few extra precautions by staying in well populated places, not straying off the beaten path and not walking by yourself at night.
Is the public transportation in Tucson safe?
The public transportation system in Tucson is handled by Sun Tran and it offers many routes that interweave throughout the entire city. The Sun Tran is generally safe to use during the commuting hours (7am – 6pm), however we do not recommend that you take the Sun Tran late at night.
What do residents of Tucson say about it’s safety?
"Tucson is not dangerous where you have to fear for your life, but property crime is a huge issue here."
" I’ve lived in Tucson for 50 years, and I never felt in danger. Unless you are a gangbanger or in the drug trade, I’d say it’s pretty hard to find yourself “in trouble”
"Generally speaking Tucson is not dangerous, but like any other city, some neighborhoods and parts of town should be avoided."
"Anywhere south of the 10 is probably one of the worst pars of Tucson. Also avoid the area around the airport."
"The bad areas of Tucson include anywhere south of Broadway, east of 1st Avenue and and north of Fort Lowell."
"South Tucson is the worst area of town. South Tucson is usually considered any south of 29th."
"Tucson is odd in that one block is nice and then all of a sudden you’re in an area with lots of poverty and crime and then the block after that is nice again."
"A good rule of thumb is to stay north of 22nd st or Broadway."
Is Tucson safe at night?
Tucson is generally safe to visit at night as long as you stay out of the problem areas and maintain situational awareness at all times. Streets and squares that are perfectly safe to visit in the daytime can be questionable and sketchy at night.
Tips to stay safe while visiting Tucson, Arizona
Do you research before you arrive. Find out which areas are nice and which areas are rough.
Don’t draw attention to yourself. The better you blend in and look like a local, the less likely you will be targeted by criminals.
Walk with confidence and purpose. Avoid looking like a lost tourist. Be discreet when looking at maps and be careful who you approach for directions.
Don’t share too much information with strangers. If someone ask where you are staying, give them the name of the general area and not the hotel or Air BnB.
Don’t wear expensive jewelry or clothing. Being a walking advertisement is a sure way to get targeted by criminals.
Avoid walking by yourself at night and avoid walking through desolate areas night.
Always be aware of your surroundings.
Be careful when using the ATM. Use only during the day time and pull on the card reader slot when using it, to make sure its not a card skimmer.
Plan your destination out beforehand on Google Maps. Make sure you exactly how to get to your destination and how to get back.
Quick Facts About Tucson, Arizona
Fact
Tucson city, Arizona
United States
Population, Census, April 1, 2020
542,629
331,449,281
Population, Census, April 1, 2010
520,116
308,745,538
Persons under 5 years, percent
6.0%
6.0%
Persons under 18 years, percent
21.2%
22.3%
Persons 65 years and over, percent
14.3%
16.5%
Black or African American alone, percent
5.2%
13.4%
American Indian and Alaska Native alone, percent
3.7%
1.3%
Asian alone, percent
3.2%
5.9%
Native Hawaiian and Other Pacific Islander alone, percent
0.2%
0.2%
Two or More Races, percent
5.4%
2.8%
Hispanic or Latino, percent
43.6%
18.5%
White alone, not Hispanic or Latino, percent
43.9%
60.1%
Foreign born persons, percent, 2015-2019
15.3%
13.6%
Median value of owner-occupied housing units, 2015-2019
$155,300.00
$217,500.00
Median selected monthly owner costs -with a mortgage, 2015-2019
$1,183.00
$1,595.00
Median gross rent, 2015-2019
$846.00
$1,062.00
High school graduate or higher, percent of persons age 25 years+, 2015-2019
85.0%
88.0%
Bachelor’s degree or higher, percent of persons age 25 years+, 2015-2019
27.4%
32.1%
In civilian labor force, total, percent of population age 16 years+, 2015-2019
60.5%
63.0%
Median household income (in 2019 dollars), 2015-2019
$43,425.00
$62,843.00
Per capita income in past 12 months (in 2019 dollars), 2015-2019
")
")
")
")
")
")
")
")
")
Leave a Reply