If you are thinking about visiting Dayton and have some qualms about the safety of the city, we got you covered.
We are going to deep dive into the statistics, look at some maps, graphs and talk to the residents of the city to give you a better understanding of how safe Dayton really is.
Is Dayton, Ohio Safe To Visit?
Statistically speaking, Dayton is a unsafe place to visit. Violent crimes are 2.8x higher than the national average. Property crimes are 2x higher than the national average. Murders are 5x higher than the national average.
In 2020, Dayton had a violent crime rate of 1,106.48 per 100,000 people and is on par with cities like Houston, Nashville and New Orleans.
Dayton, Ohio Crime Stats
Here’s a breakdown of all the crimes in the city for 2020 compared to 2019:
In 2020 Dayton reported 1,523 violent crimes and had a violent crime rate of 1,106.48 per 100,000 people.
The national average for violent crime is 398.5 per 100,000 residents. Dayton ’s violent crime rate is 2.8x greater than the national average.
Year over year violent crime has increased by 12%.
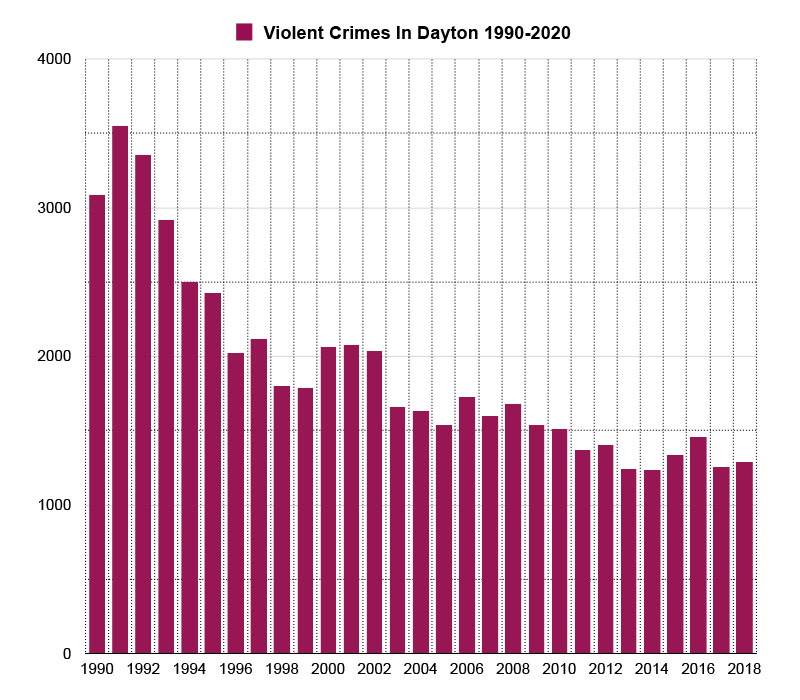
Here’s a map showing you how violent crime has trended in Dayton over a 30 year period.
Violent crime peaked in 1991 when there were 3,556 violent crimes reported and the city had a violent crime rate of roughly 1,975.56 per 100,000 people.
Violent crime has decreased over 57% from it’s 30-year high in 1995.
*Violent crimes include; homicides, rape, robbery and aggravated assaults and the violent crime rate is calculated by dividing the number of reported crimes by the total population; the result is multiplied by 100,000.
Dayton’s Property Crime Stats
In 2020 Dayton reported 5,391 property crimes and had a property crime rate of 3,916.63 per 100,000 people.
The national average for property crime is 1958.2 per 100,000 residents. Dayton’s property crime rate is 2x greater the national average.
Year over year property crime in Dayton has decreased by 6%.
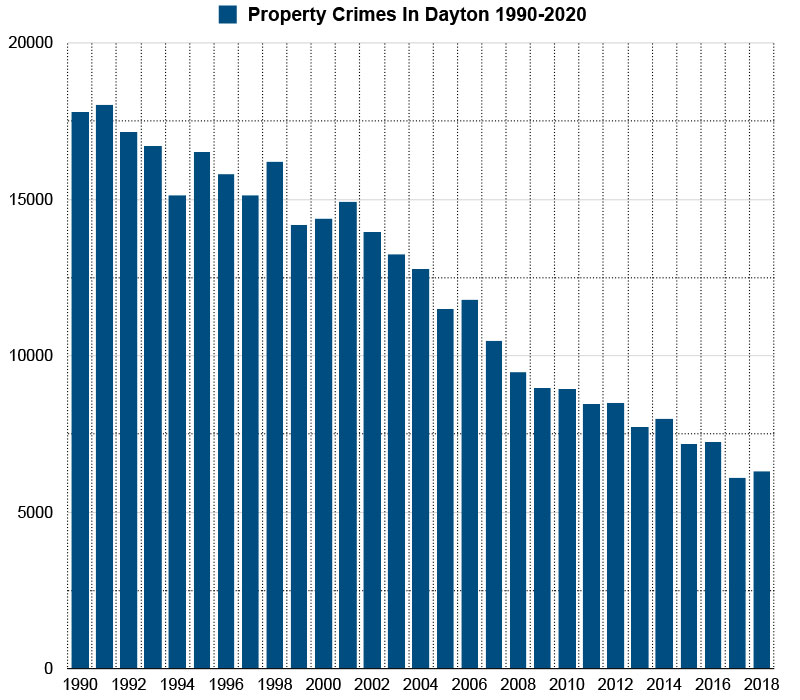
Here’s a map showing you how property crime has trended in Dayton over a 30 year period.
Property crime peaked in 1990 when there were 18,044 property crimes reported and the city had a property crime rate of roughly 10,024.44 per 100,000 people.
Property crime has decreased over 70% from it’s 30-year high in 1991.
*Property crimes include; burglary, larceny-theft, motor vehicle theft, and arson and property crime rate is calculated by dividing the number of reported crimes by the total population; the result is multiplied by 100,000.
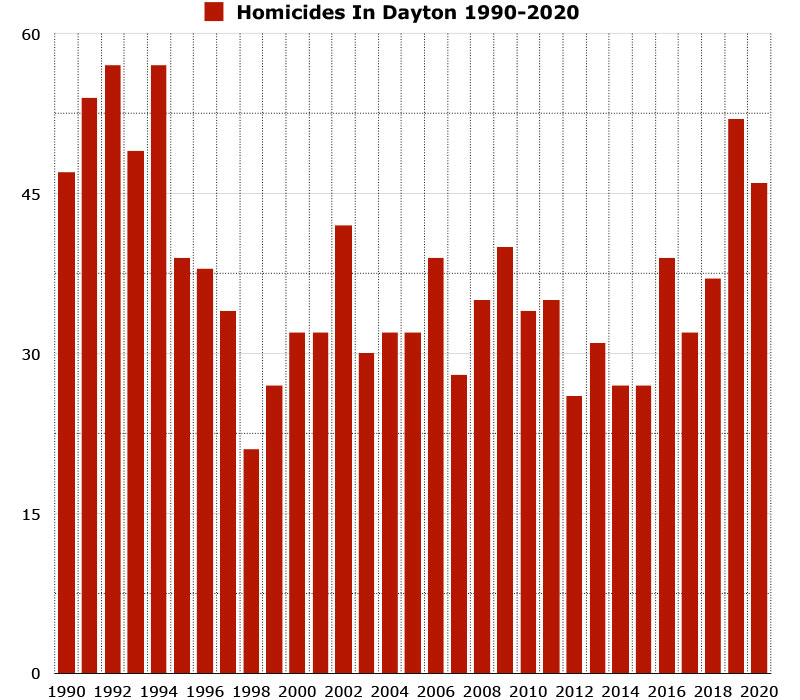
Dayton’s Murder Stats
In 2020, Dayton reported 46 homicides, a 11.5% decrease over 2019, where 52 homicides were reported.
In 2020 Dayton had a homicide rate of 33.4 per 100,000 people.
Dayton’s murder rate is more than 5x greater than the national average.
As of Dec 19, 2021, Dayton has \ reported 29 homicides, a significant year over year decrease over 2020.
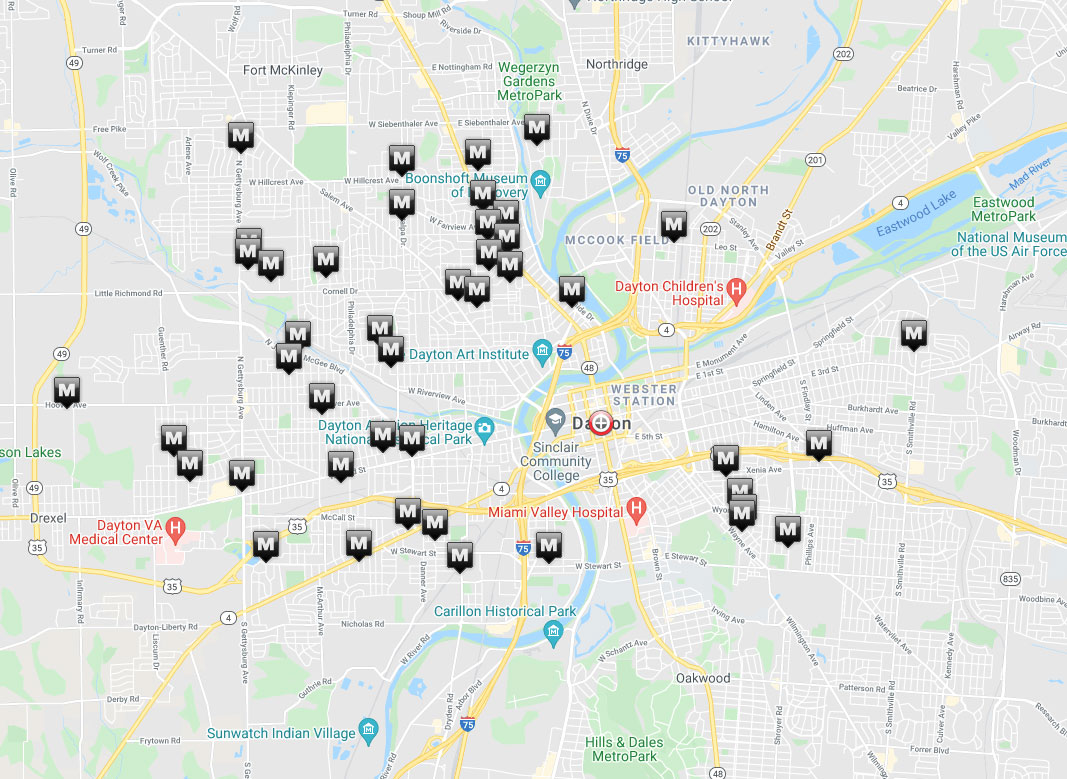
Here’s a map showing you the locations of all the homicides in 2020:
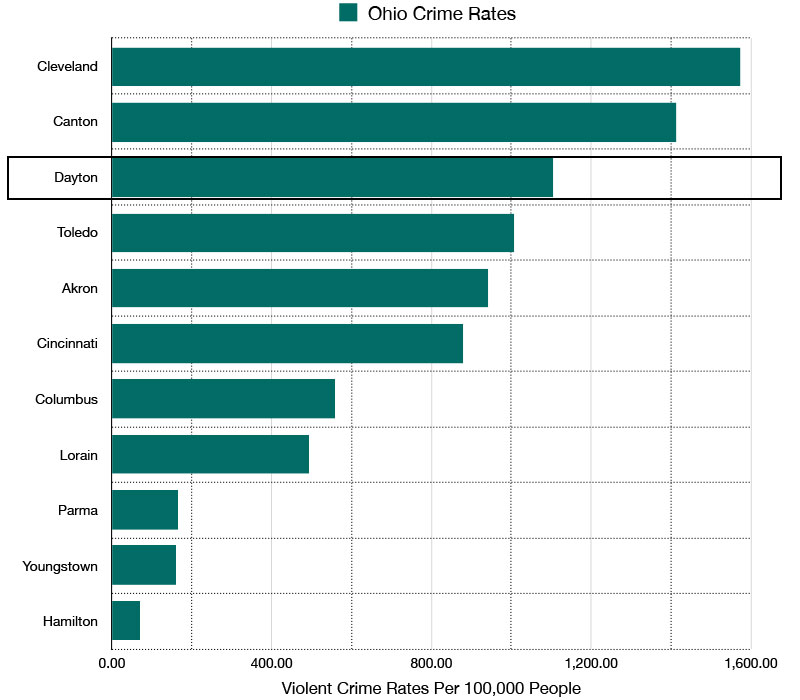
Dayton vs The Rest Of Ohio
Here’s a graph showing you the violent crime rates of the 11 most populous cities in Ohio. Dayton had the 2nd highest violent crime rate in the state.
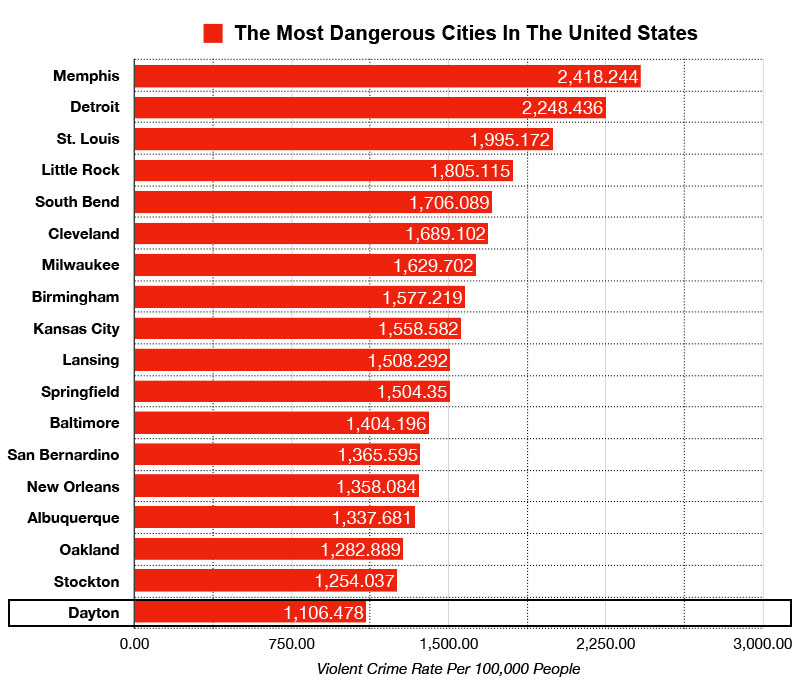
Dayton, Ohio vs The Most Dangerous Cities in the United States
Here’s a list of the top 17 most dangerous cities in the United States ranked by violent crime rates. Dayton’s violent crime rate ranks 14th place. It’s violent crime rate is 2.2x less than Memphis, the most dangerous city on the list.
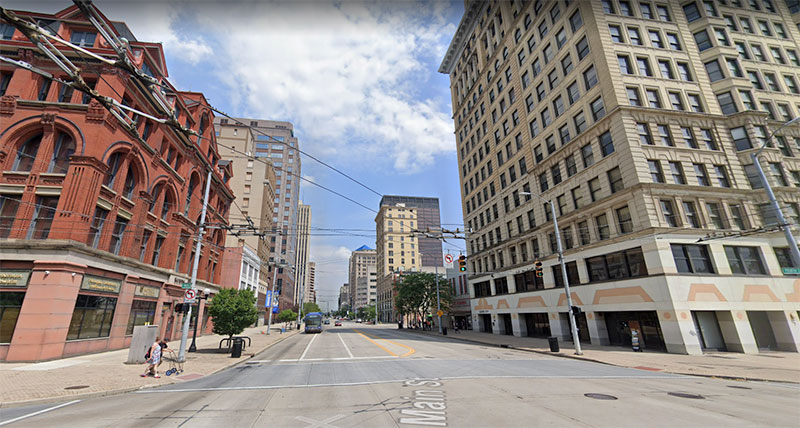
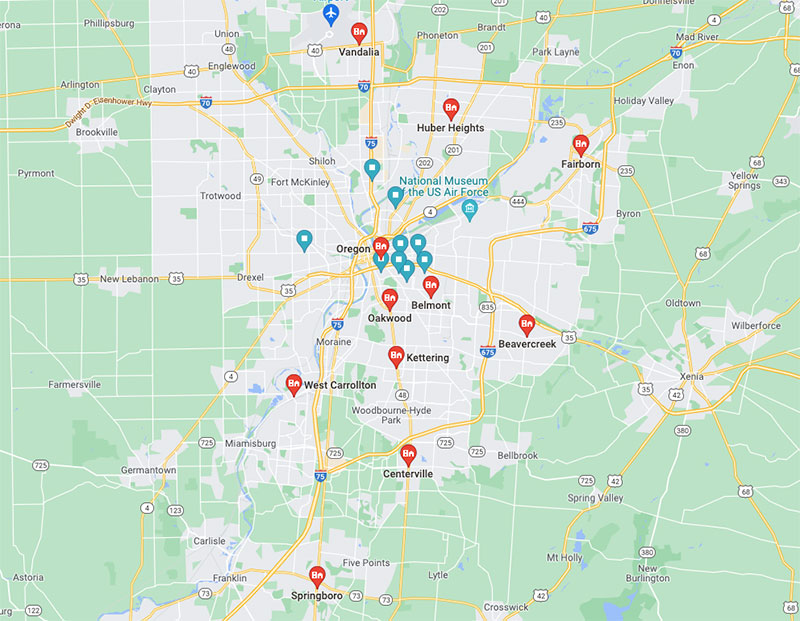
Downtown Dayton is a generally safe area to visit during the DAYTIME and as long as you stay within the main area of downtown.
We recommend that you stay within the vicinity of the downtown area, as the areas get sketchier as you move further away from it.
Driving tour of Downtown Dayton:
What do residents of Dayton, Ohio say about it’s safety?
"West Dayton can be rough. They don’t call it Dirty Dayton for nothin."
" The bad neighborhoods are scattered all throughout Dayton."
"As far as the “rough” areas, I would stay out of downtown and the west side in general. It has some “nice” parts but typically it’s not worth the bother."
"Trotwood and Northridge are two of the highest crime areas."
"Stick to south or east parts of Dayton. West for me is a great big negatory."
"Avoid Trotwood, West Dayton or Northwest Dayton"
"I would stay away from anywhere on the west side."
"Inner-city Dayton is a little more rough but the surrounding areas like Beavercreek, Vandalia, Kettewring and Englewood are pretty safe."
"It’s really just the east and west side of Dayton that are bad."
"The west side is a bit more dangerous than the east side, but only if you’re walking around alone at night really."
"If you are not in a gang and don’t buy or sell heroin, meth or crack, your safety greatly increases."
"I avoid Old North Dayton and the westside entirely."
"The west side of Dayton isn’t that bad as people try to make it seem but it’s bad."
"The whole North Side is rough, except for the North East part which is the “Suburban” or more affluent part of Dayton"
"Dayton, Ohio aka ‘Little Detroit’. When General Motors left, Dayton died. It’s this simple, but Dayton is slowly recovering. Slowly."
Is Dayton, Ohio Safe For Women?
Dayton is safe for female solo travelers, as long as you learn the layout of the city, avoid problem areas, don’t walk alone at night and follow general precautionary measures.
Tips to stay safe while visiting Dayton
Learn the layout of the city. Avoid going to the places where crime is high (west and east Dayton).
Don’t leave valuables in your car or in plain sight in your car. Always lock your doors.
Keep your gas tank filled. You don’t want to end up in the wrong part of town at night, searching for a gas station.
Always be aware of your surroundings. Don’t listen to music while waking around town and don’t scroll through your phone mindlessly.
Don’t walk alone by yourself at night.
When going out, avoid excessive drinking. Always be in control.
Avoid walking through deserted or desolate area at night. Avoid walking through alleys and unlit areas.
Always trust your intuition. If something feels off, leave the situation.
Quick Facts About Dayton, Ohio
Fact
Dayton, Ohio
United States
Population, Census, April 1, 2020
137,644
331,449,281
Population, Census, April 1, 2010
141,527
308,745,538
Black or African American alone, percent
37.9%
13.4%
American Indian and Alaska Native alone, percent
0.3%
1.3%
Asian alone, percent
1.1%
5.9%
Native Hawaiian and Other Pacific Islander alone, percent
0.0%
0.2%
Two or More Races, percent
3.7%
2.8%
Hispanic or Latino, percent
4.4%
18.5%
White alone, not Hispanic or Latino, percent
53.0%
60.1%
Median value of owner-occupied housing units, 2015-2019
$66,800.00
$217,500.00
Median selected monthly owner costs -with a mortgage, 2015-2019
$977.00
$1,595.00
Median gross rent, 2015-2019
$706.00
$1,062.00
High school graduate or higher, percent of persons age 25 years+, 2015-2019
83.4%
88.0%
Bachelor’s degree or higher, percent of persons age 25 years+, 2015-2019
18.4%
32.1%
In civilian labor force, total, percent of population age 16 years+, 2015-2019
56.8%
63.0%
Median household income (in 2019 dollars), 2015-2019
$32,540.00
$62,843.00
Per capita income in past 12 months (in 2019 dollars), 2015-2019

")
")
")
")
")
")
")
")
")
Leave a Reply