If you are thinking about visiting Jackson and have some qualms about the safety of the city, we got you covered.
We are going to deep dive into the statistics, look at some maps, graphs and talk to the residents of the city to give you a better understanding of how safe Jackson really is.
Is Jackson, Mississippi Safe To Visit?
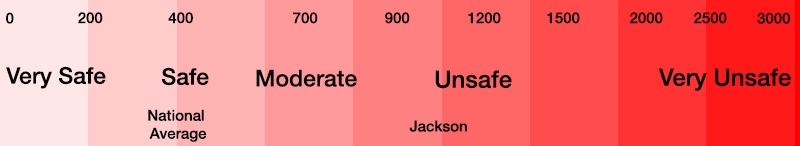
Statistically speaking, Jackson is a unsafe place to visit. In 2020, Jackson had a violent crime rate of 1,050.09 per 100,000 people and is 2.6x greater than the national average.
In 2021, Jackson was named the Murder Capital of the U.S. It reported 152 murders and had a murder rate of 99.54 per 100,000 people.
Here’s a scale to give you some perspective on Jackson’s violent crime rate:
Jackson, Mississippi Crime Stats
Here’s a breakdown of all the crimes in the city for 2020 compared to 2019:
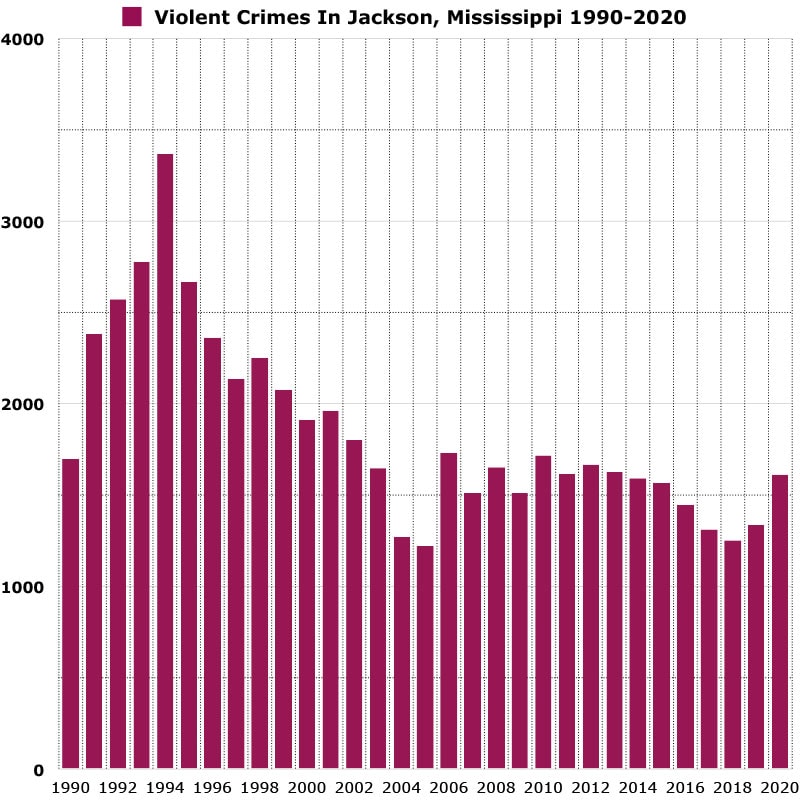
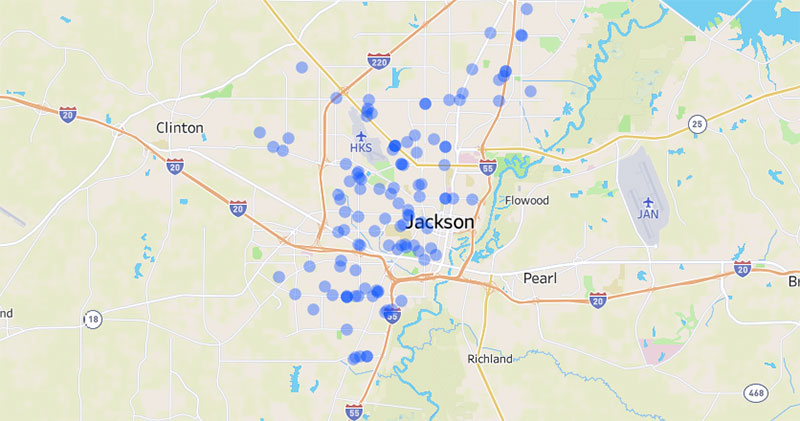
Here’s a map showing you how violent crime has trended in Jackson over a 30 year period.
Jackson’s violent crime peaked in 1994 when there was 3,368 violent crimes reported and had a violent crime rate of 1731.62 per 100,000 people.
Violent crime has decreased by 52% from it’s peak in 1994.
*Violent crimes include; homicides, rape, robbery and aggravated assaults and the violent crime rate is calculated by dividing the number of reported crimes by the total population; the result is multiplied by 100,000.
Jackson’s Property Crime Stats
In 2020 Jackson reported 6,579 property crimes and had a property crime rate of 4,280.39 per 100,000 people.
The national average for property crime is 1958.2 per 100,000 residents. Jackson’s property crime rate is 2.2x greater than the national average.
Jackson’s property crime rate is roughly 2x greater than the state average.
Year over year property crime in Jackson has decreased by 13%.
Property crime is at its lowest level in 30 years.
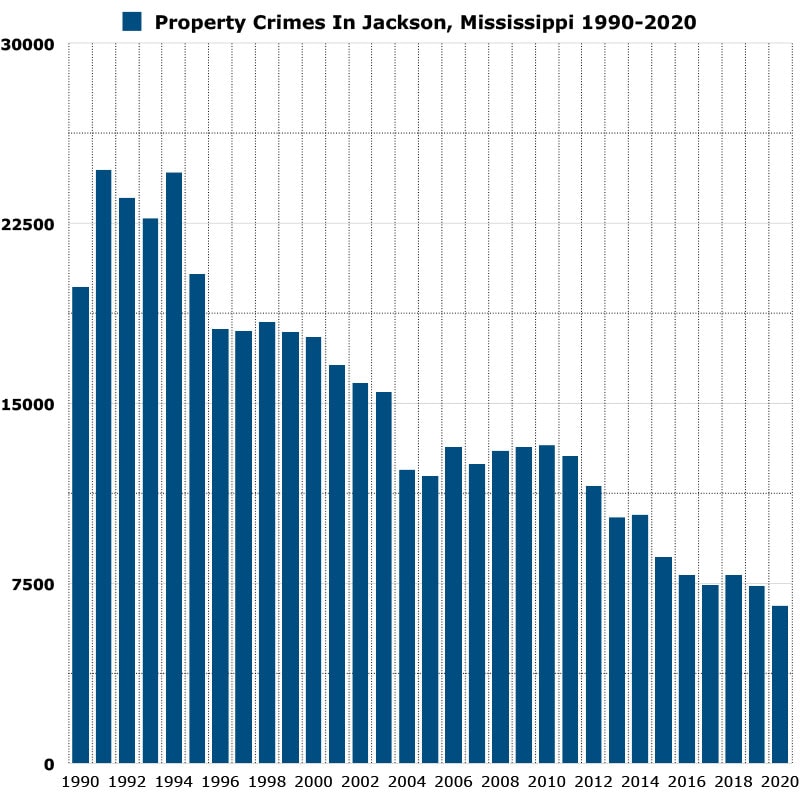
Here’s a map showing you how property crime has trended in Jackson over a 30 year period.
Property crime peaked in 1994 when there were 24,740 property crimes reported and the city had a property crime rate of roughly 12,719.79 per 100,000 people.
Property crime has decreased 73% from it’s 30-year high in 1994.
*Property crimes include; burglary, larceny-theft, motor vehicle theft, and arson and property crime rate is calculated by dividing the number of reported crimes by the total population; the result is multiplied by 100,000.
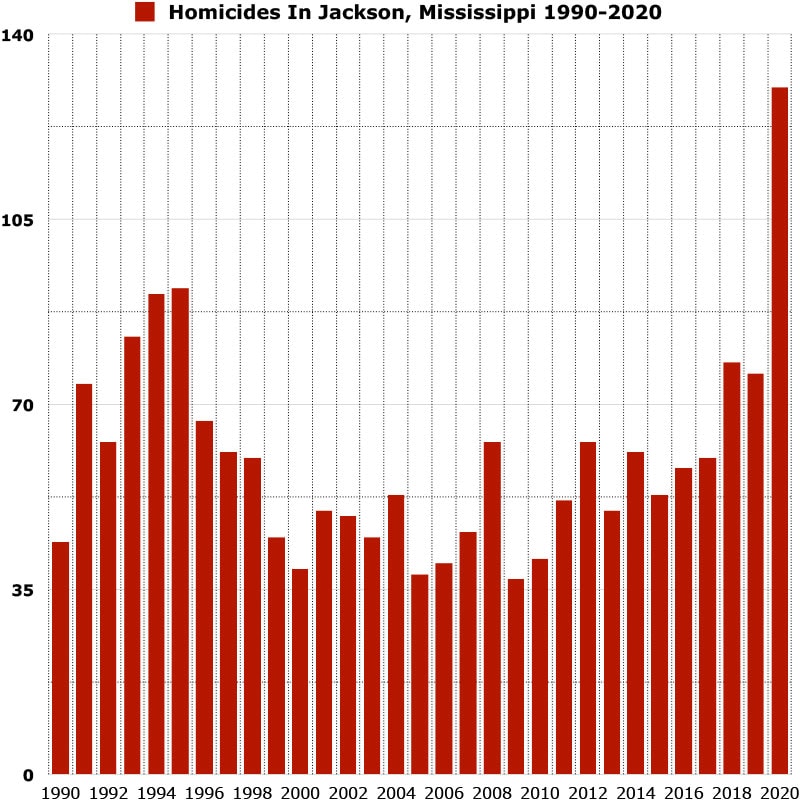
Jackson’s Murder Stats
In 2020, Jackson reported 130 homicides and had a homicide rate of 84.58 per 100,000 people.
Jackson’s homicide rate is 13x greater than the national average and 8x greater than the state average.
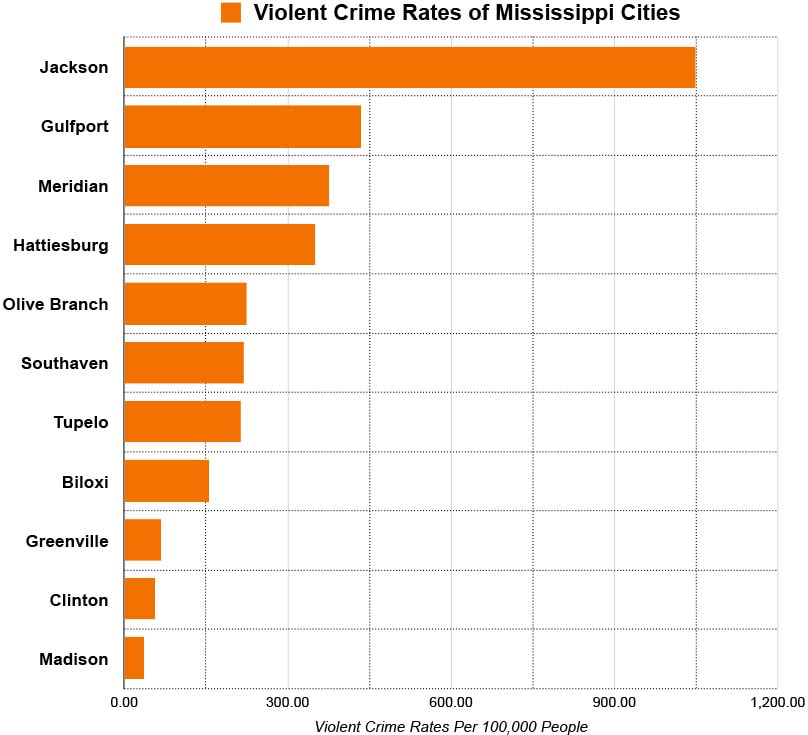
Here’s a graph showing you the violent crime rates of the 18 cities in Mississippi. Jackson’s violent crime rate ranked 12th highest among all cities.
Population
Violent Crime Rate
Jackson
153,701
1,050.09
Gulfport
72,926
434.69
Meridian
35,052
376.58
Hattiesburg
48,730
350.91
Olive Branch
39,711
224.12
Southaven
54,648
219.59
Tupelo
37,923
213.59
Biloxi
49,449
155.72
Greenville
29,670
67.41
Clinton
28,100
56.94
Madison
27,747
36.04
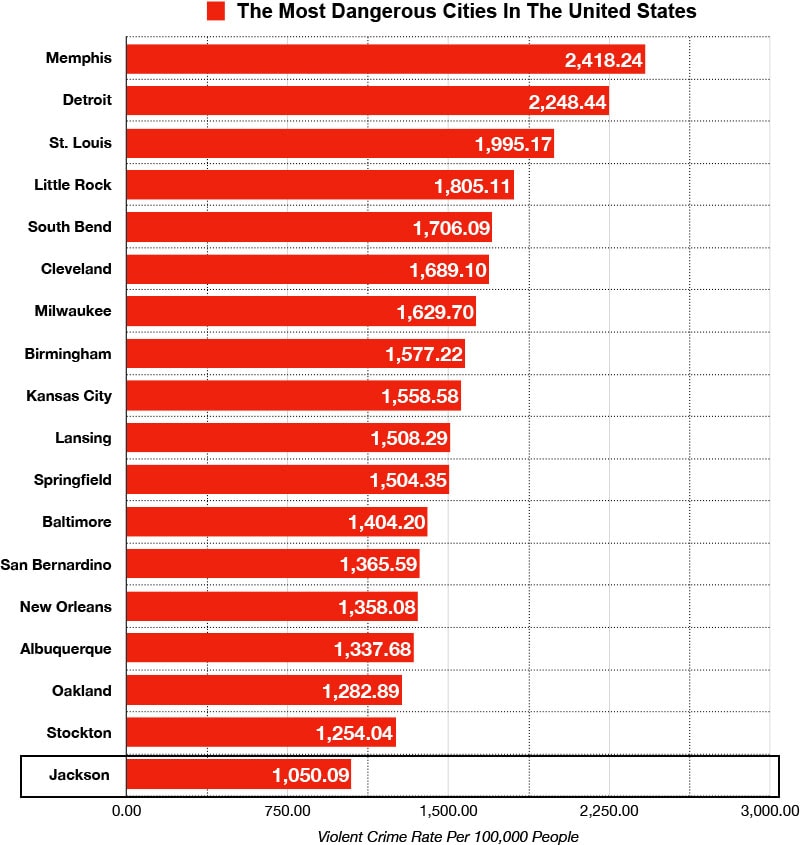
Jackson, Mississippi vs The Most Dangerous Cities in the United States
Here’s a list of the top 18 most dangerous cities in the United States ranked by violent crime rates. Jackson’s violent crime rate is 4.5x less than Memphis, the most dangerous city on the list.
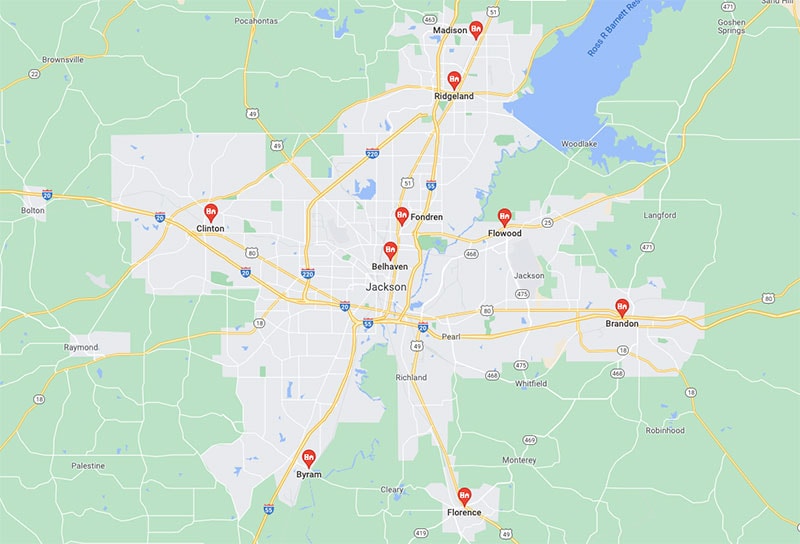
Safest Neighborhoods In Jackson, Mississippi
Fondren
Bellhaven
Flowood
Ridgeland
Madison
Brandon
Florence
Byram
Terry
Clinton
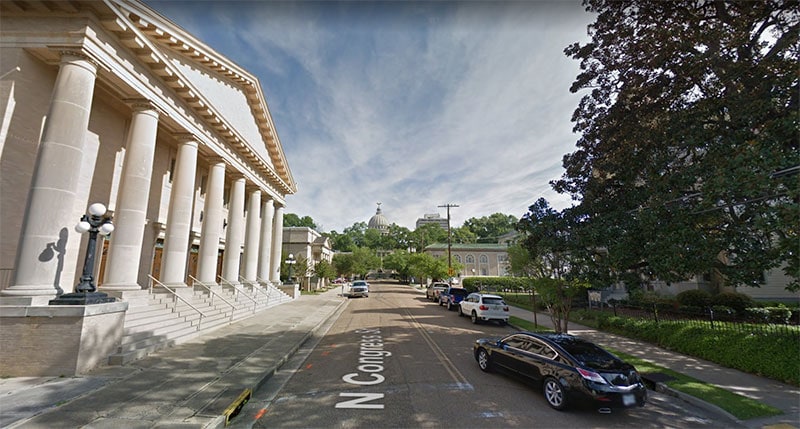
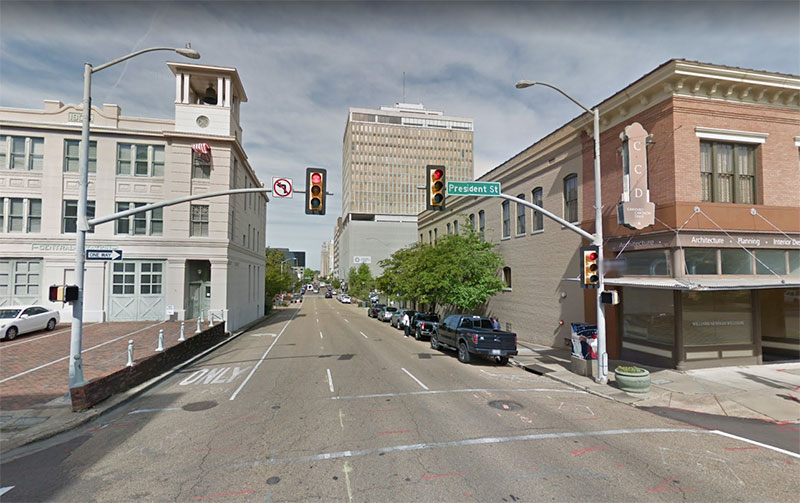
Is Downtonw Jackson, Mississippi Safe?
Downtown Jackson is generally a very safe area to visit during the day time. At night the situation changes and pretty much everything shuts down aside from a few bars. Streets and squares that are perfectly safe in the day can be questionable at night.
We recommend that you save the sightseeing for the daytime and at night to take precautions in regards to staying in well populated places, not straying off the beaten path and not walking around at night.
Is Jackson, Mississippi safe from hurricanes?
Jackson is at very low risk from hurricanes and is something that doesn’t concern residents of the city.
Is Jackson safe from tornadoes?
Jackson is not completely safe from tornadoes and is susceptible to them.
Most recently, in May of 2021, several tornadoes hit the Jackson area and brought winds of up to 100mph.
The public transportation system in Jackson is handled by JTRAN and it offers 10 routes that interweave throughout the entire city and its surrounding neighborhoods.
It is generally safe during commuting hours (8am – 5pm), however we do not recommend that you take the bus at night. You should opt for a taxi or ride sharing service instead.
What do residents of Jackson say about it’s safety?
"I’m not going to pretend that Jackson is the safest place in the world, because it’s not. It’s not the most dangerous city either. There are rough parts of town but that is true of any city."
“West Jackson is the worst part of Jackson and South Jackson is also rough.”
"South Jackson is the worst area with West Jackson as a close second."
"Learn the different areas of Jackson as they are very different."
"I grew up in Jackson and the city is no longer safe in many areas."
"Jackson is not the city it once was."
"Most crime occurs in the south and southwest portions of Jackson, but its an area that’s doesn’t offer much for tourist anyways, besides the zoo."
"A good rule of thumb is to avoid areas between of Interstates 55 and 220 after dark"
"Downtown, South and West Jackson are sketchy, especially at night."
"Crime is an issue in Jackson, but it’s not as bad as the media plays it out to be, but it’s there."
North east Jackson is probably the safest area within the city."
"South Jackson and West Jackson are really rough and have crime problems, but the majority of Central, North, and East Jackson are actually really nice."
Is Jackson safe for women?
Jackson is generally safe for female solo travelers as long as you learn the layout of the city, avoid problem areas, stay in well lit/well populated areas and avoid walking by yourself at night.
Is Jackson safe at night?
Jackson is not the safest place at night. Avoid walking by yourself at night and save the sightseeing for the day time. Avoid South Jackson and avoid West Jackson.
Tips to stay safe while visiting Jackson, Mississippi
Avoid the problem areas. Use your eyes. Does the area look sketchy? Are there gang taggings sprayed all over walls and on signs? Are the houses dilapidated
Research the city before you arrive. Learn which areas to avoid and book your accommodations accordingly.
Create a detailed itinerary of places you want to visit, scout out the locations ahead of time using Google Street View and see if it’s an area that you are comfortable with visiting.
Always be aware of your surroundings. It’s easy to let your guard down but you should always maintain a level of awareness wherever you are.
Always be aware of your belongings. Don’t leave things unattended.
Don’t walk around alone at night, especially if you are a woman. Use a ride sharing service to get to your location. Avoid using public transportation at night.
Don’t wak by yourself at night. Avoid walking through alleys and desolate areas.
Don’t leave valuables in your car. Or if you cant avoid it, don’t leave it in plain sight.
Trust your gut and intuition. If something doesn’t seem right, remove yourself from the situation.
Don’t be a walking advertisement. Leave the expensive jewelry, watches, purses and clothing at home.
")
")
")
")
")
")
")
")
")
Leave a Reply