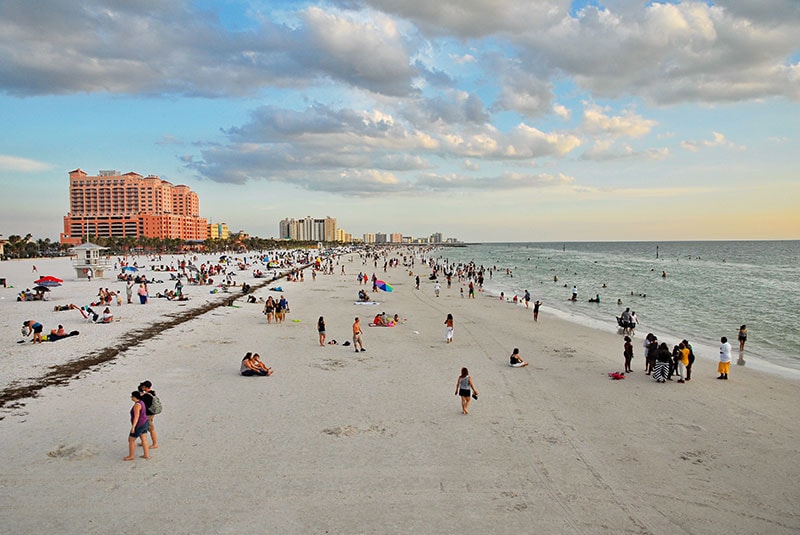
If you are thinking about visiting Clearwater and have some qualms about the safety of the city, we got you covered.
We are going to deep dive into the statistics, look at some maps, graphs and talk to the residents of the city to give you a better understanding of how safe Clearwater really is.
Is Clearwater, Florida Safe To Visit?
Statistically speaking, Clearwater is a safe place to visit. In 2020, Clearwater had a violent crime rate of 392.18 per 100,000 people. It’s violent crime rate is on par with the national average and is similar to cities like El Paso, San Jose and San Diego.
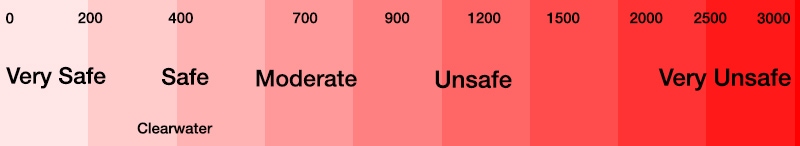
Here’s a scale to give you some perspective on Clearwater’s violent crime rate:
Clearwater, Florida Crime Stats
Here’s a breakdown of all the crimes in the city for 2020 compared to 2019:
In 2020 Clearwater reported 460 violent crimes and had a violent crime rate of 392.18 per 100,000 people.
The national average for violent crime is 398.5 per 100,000 residents. Clearwater’s violent crime rate is 2% less than the national average.
Clearwater’s violent crime rate is 2% greater than the state average.
Year over year violent crime has decreased by 2%.
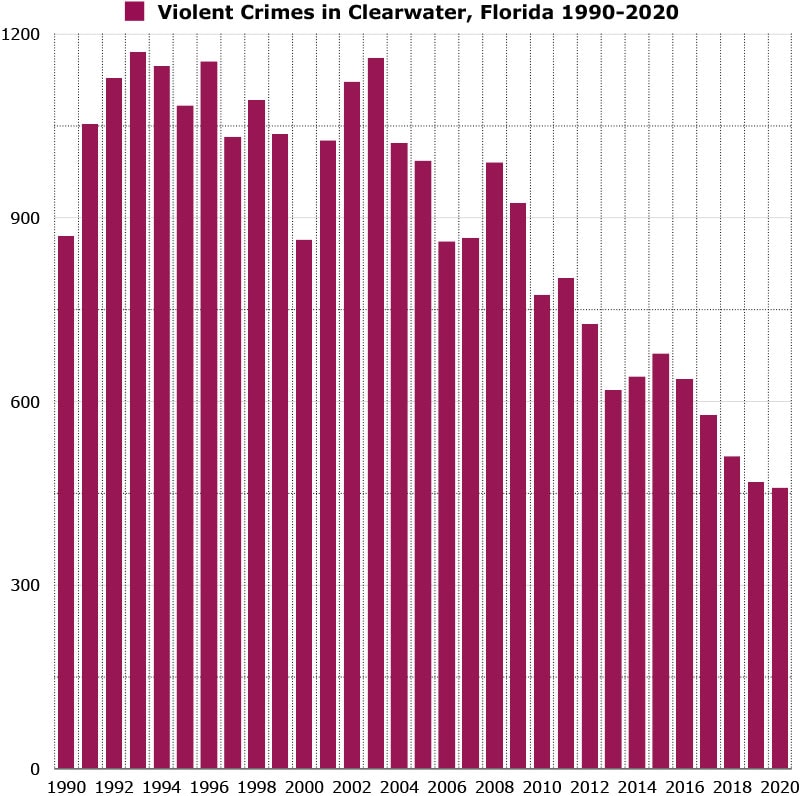
Here’s a map showing you how violent crime has trended in Clearwater over a 30 year period.
Clearwater’s violent crime peaked in 1993 when there was 1,171 violent crimes reported and had a violent crime rate of 1,171 per 100,000 people.
Violent crime has decreased by 61% from it’s peak in 1993.
Violent crime is at its lowest level in 30 years.
*Violent crimes include; homicides, rape, robbery and aggravated assaults and the violent crime rate is calculated by dividing the number of reported crimes by the total population; the result is multiplied by 100,000.
Clearwater’s Property Crime Stats
In 2020 Clearwater reported 2,232 property crimes and had a property crime rate of 1,902.94 per 100,000 people.
The national average for property crime is 1958.2 per 100,000 residents. Clearwater’s property crime rate is roughly 3% less than the national average.
Clearwater’s property crime rate is roughly 8% greater than the state average.
Year over year property crime in Clearwater has decreased by 26%.
Clearwater property crime rate is similar to Virginia Beach, Boston and Santa Ana.
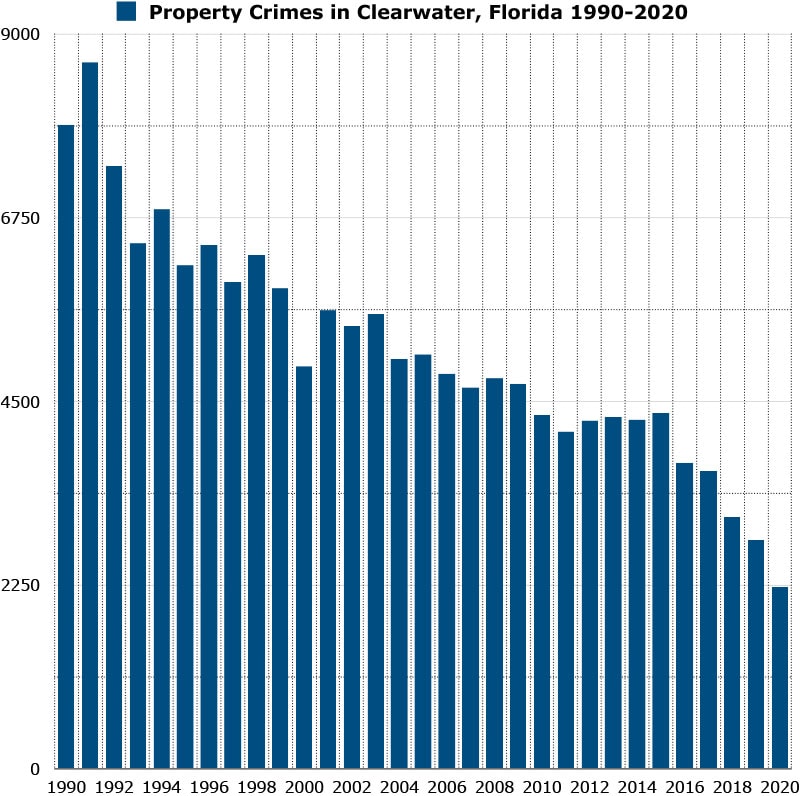
Here’s a map showing you how property crime has trended in Clearwater over a 30 year period.
Property crime peaked in 1991 when there were 8,651property crimes reported and the city had a property crime rate of roughly 8,651.00 per 100,000 people.
Property crime has decreased 74% from it’s 30-year high in 1991.
Property crime is at its lowest level in 30 years.
*Property crimes include; burglary, larceny-theft, motor vehicle theft, and arson and property crime rate is calculated by dividing the number of reported crimes by the total population; the result is multiplied by 100,000.
Clearwater’s Murder Stats
In 2020, Clearwater reported 0 homicides and had a homicide rate of 0 per 100,000 people.
Clearwater has a similar homicide rate to cities like Irvine, Chula Vista and Fremont.
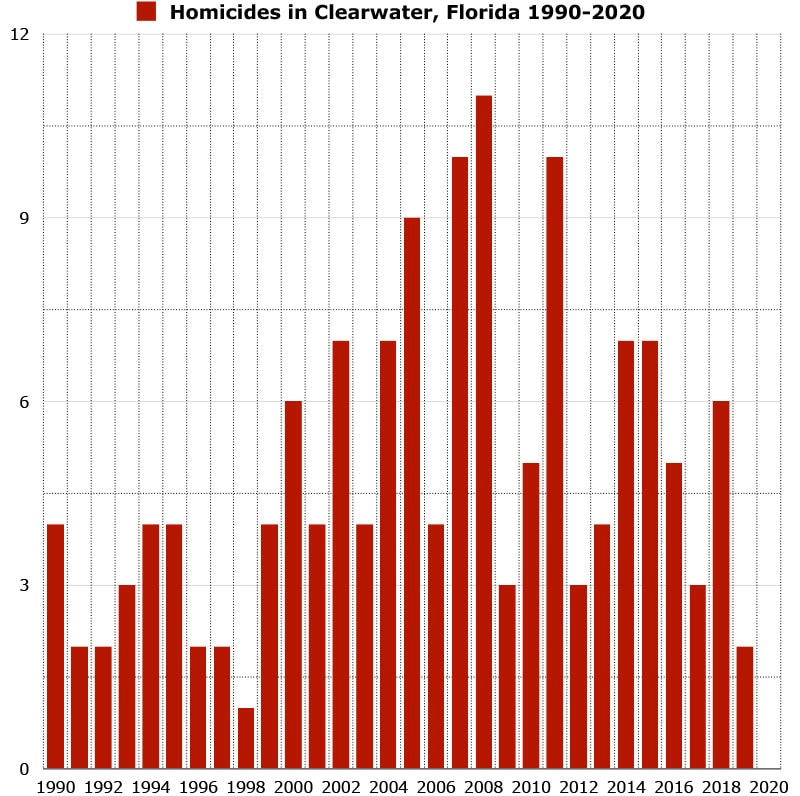
Here’s a map showing you how homicides has trended in Clearwater over a 30 year period.
Homicides in Clearwater peaked in 2008 when 11 homicides were reported and had a homicide rate of 10.22 per 100,000 people.
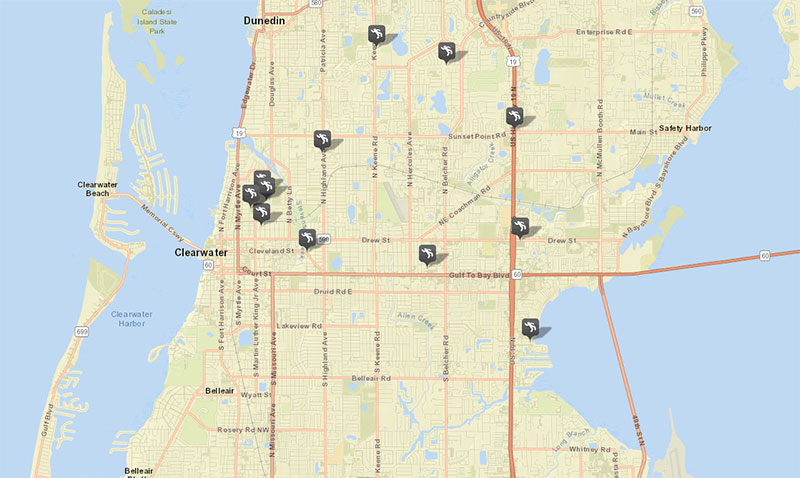
Here’s a map showing you all the homicides in Clearwater from Jan 1, 2021 – Jan 1, 2022
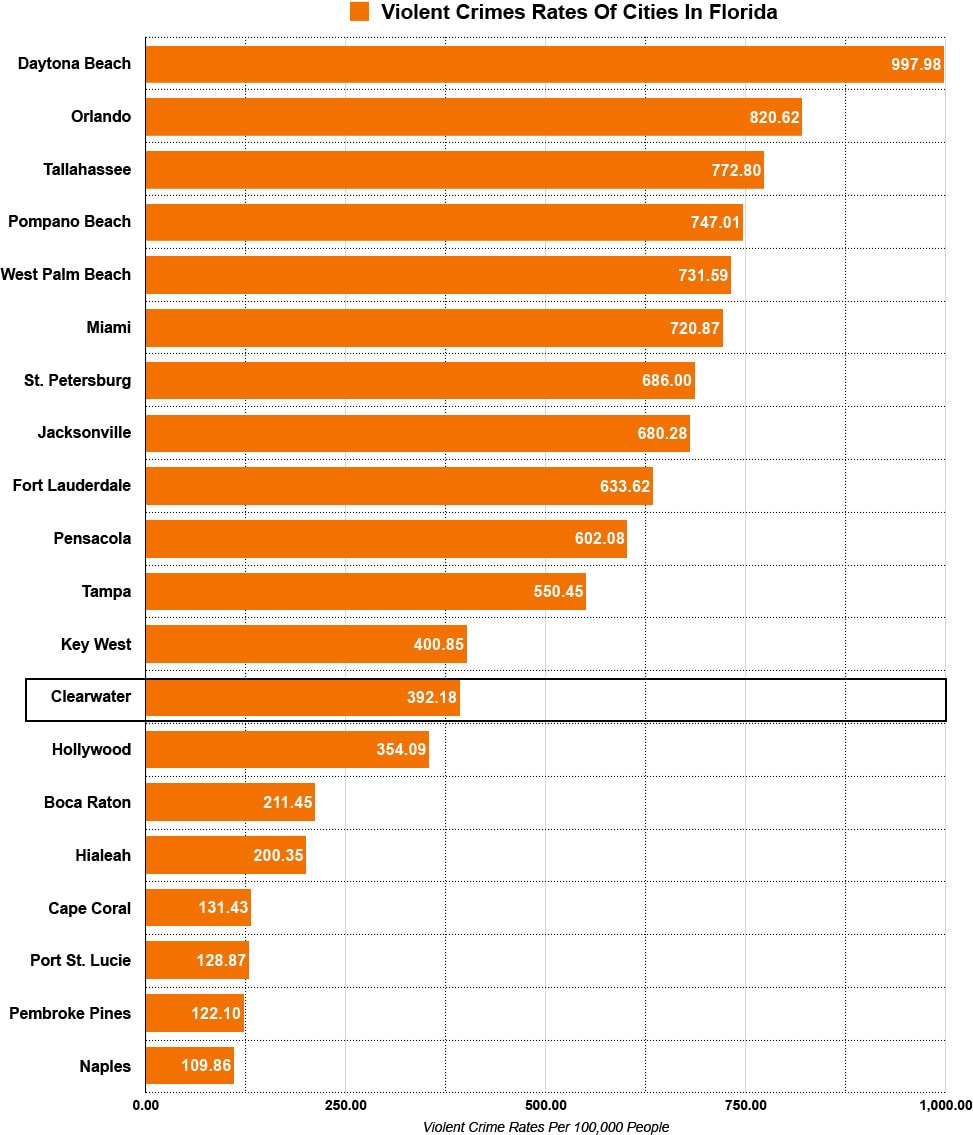
Here’s a graph showing you the violent crime rates of the 18 cities in Florida. Clearwater’s violent crime rate ranked 13th highest among all cities. Clearwater’s violent crime rate is 2.5x less than Daytona Beach, the most dangerous city on the list.
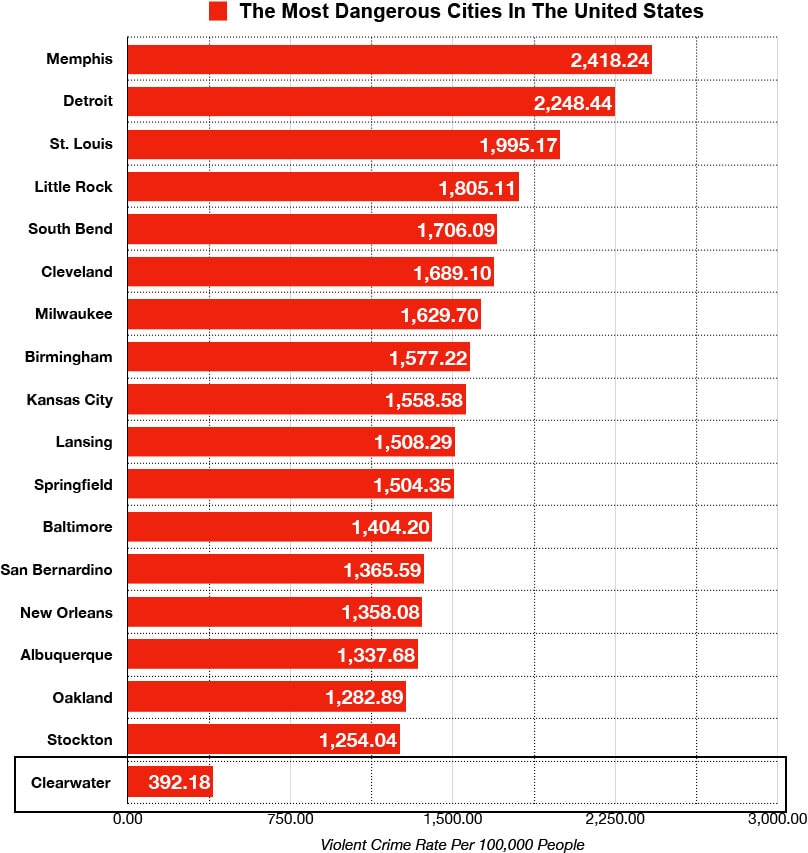
Clearwater, Florida vs The Most Dangerous Cities in the United States
Here’s a list of the top 18 most dangerous cities in the United States ranked by violent crime rates. Clearwater’s violent crime rate is 6.2x less than Memphis, the most dangerous city on the list.
Clearwater is susceptible to hurricanes due to its location on the coast and is something you have to take into consideration when visiting.
The last major storm to hit Clearwater was Hurricane Irma in 2017.
Hurricane season in Clearwater officially runs from June 1 to Nov. 30. The peak of hurricane season is mid-August to mid-October.
It should be noted that hurricane season does not mean a hurricanes will occurr. They are still rare events and it just means that it is highly unusual for any hurricane to occur OUTSIDE of hurricane season.
Is it safe to visit Clearwater during hurricane season?
It is safe to visit Clearwater during hurricane season, as long as you don’t visit when a hurricane is about to hit! Fortunately there is usually adequate warning when a hurricane is brewing in the area.
Here’s a video of a tornoado that could be seen from Clearwater Beach in 2020:
Is the public transportation in Clearwater safe?
The public transportation system in Clearwater is handled by PSTA (Pinellas Suncoast Transit Authority) and it offers many routes that interweave throughout Clearwater and Pinellas County.
It is generally safe during commuting hours (8am – 6pm), however we do not recommend that you take the bus at night. You should opt for a taxi or ride sharing service instead.
What do residents of Clearwater say about it’s safety?
"Clearwater is pretty quiet for the most part."
"Stay away from Greenwood if you don’t like being mugged."
"Clearwater is a safe town, but it is boring as well. Not much to do besides going to the beach."
"Clearwater is quaint. The only problem area is in Greenwood."
Is Clearwater safe for women?
Clearwater is generally safe for female solo travelers as long as you learn the layout of the city, avoid problem areas, stay in well lit/well populated areas and avoid walking by yourself at night.
Is Clearwater safe at night?
Clearwater is safe at night as long as you stay away from the sketchy neighborhoods mentioned above. You should be able to mitigate your chances of being a victim if you study the layout of the city and avoid areas where crime is high.
Streets and squares that are perfectly safe in the day can be questionable at night. Stay where the tourists go during the day and avoid any places that are outside normal pedestrian areas at night.
Is Clearwater’s tap water safe to drink?
The tap water in Clearwater, Florida is safe to drink. In 2020, Clearwater met or exceeded all state and federal drinking water standards.
While the tap water in Clearwater meets the EPA health guidelines, it can still contain contaminants present in trace amounts that could potentially cause health issues over the long-run.
The biggest concern with tap water is immediately after a hurricane, which can disrupt the flow of clean water.
If you have any concerns about the tap water in Clearwater, we suggest that you use bottle water for your drinking needs.
Tips to stay safe while visiting Clearwater, Florida
Check the weather forecast a few days before you arrive. Make sure you are not arriving in the midst of a major storm system.
Do you research before you visit. Figure out which parts of the city you should avoid and book your accomodations accordingly.
Always be aware of your surroundings. When walking around time, don’t listen to music and don’t bury yourself in your headphones.
Don’t give away information about where you are staying to strangers.
Don’t drink in excess.
Don’t leave valuables in your car or in plain sight in your car.
Things To Do In Clearwater According To Locals
Sunken Gardens – A botanical garden that offers a peaceful stroll through an oasis of beautiful plants and animals

")
")
")
")
")
")
")
")
")
Leave a Reply