If you are thinking about visiting Bakersfield and have some qualms about the safety of the city, we got you covered.
We are going to deep dive into the statistics, look at some maps, graphs and talk to the residents of the city to give you a better understanding of how safe Bakersfield really is.
Is Bakersfield Safe?
Looking at the crime statistics, Bakersfield is a safe place to visit. In 2019, Bakersfield had a violent crime rate of 467.29 per 100,000 people. Out of the 100 most populous cities in the United States, Bakersfield’s violent crime rate ranked 68th. Santa Ana, Riverside and Glendale (Arizona) all have similar crime rates as Bakersfield.
Bakersfield’s Population
The population for the Bakersfield in 2019 is 377,917
Bakersfield Crime Stats
Here’s a breakdown of all the crimes in Bakersfield for 2018 and 2019.
In 2019 Bakersfield reported 1,766 violent crimes and had a violent crime rate of 467.29 per 100,000 people. The national average for violent crime is 366.7 per 100,000 residents. Bakersfield’s violent crime rate is 27% higher than the national average.
*Violent crimes include; homicides, rape, robbery and aggravated assaults and the violent crime rate is calculated by dividing the number of reported crimes by the total population; the result is multiplied by 100,000.
Bakersfield Property Crime Rate
In 2019 Bakersfield reported 16,544 property crimes and had a property crime rate of 4,377.68 per 100,000 people. The national average for property crime is 2,109.9 per 100,000 residents. Bakersfield’s property crime rate is twice the national average.
Out of the 100 most populous cities in the United States, Bakersfield’s property crime rate ranked 32nd..
**Property crimes include; arson, burglary, larceny-theft, and motor vehicle theft are classified as property crimes. The property crime rate is calculated by dividing the number of reported crimes by the total population; the result is multiplied by 100,000.
Bakersfield Murder Stats
In 2019 Bakersfield reported 34 homicides, which gives it a murder rate of 9 per 100,000 residents. The national murder rate is 5 per 100,000 people. Bakersfield’s murder rate is 80% higher than the national average.
Out of the 100 most populous cities in the United States, Bakersfield’s murder rate ranked 40th.
To put it in perspective, St. Louis had a murder rate of 86.87 in 2020. Bakersfield’s murder rate is 9.65 times LESS than St. Louis.
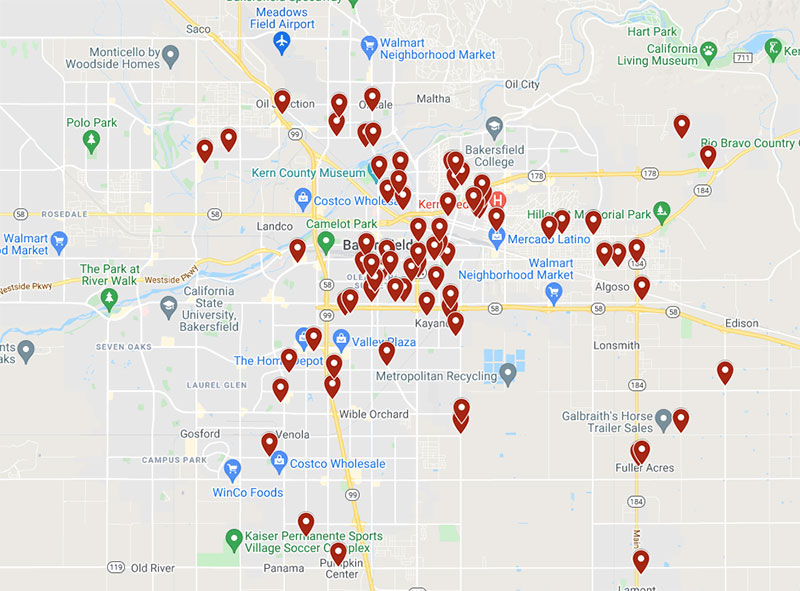
In 2020, Bakersfield reported 45 homicides, which is a 32% increase over 2019.
Here’s a map showing you the locations of all the homicides for the city in 2020
Bakersfield vs The Rest Of California
Here’s a table showing you violent crime rate and property crime rate of the top 20 most populous cities in the state of California.
Bakersfield’s violent crime rate of 467.29, places it in 10th place behind Riverside.
Bakersfield vs The Most Dangerous Cities In The United States
Here’s a list of the top 10 most dangerous cities in the United States ranked by violent crime rate. It can give you some perspective on Bakersfield’s violent crime rate, which is 467.29 per 100,000 people.
Bakersfield’s violent crime rate is 5.17 times LESS than Memphis, the most dangerous city on the list.
What do residents of Bakersfield say about its safety
"The northwest and southwest parts of town are probably the safest. As you move east, it gets slowly worse until the 99 and then the ball completely drops off. Although, it’s not as bad as everyone makes it out to be."
"Stay west of the 99 and you will be good. I’ve lived in Rosedale for most of my life and never felt unsafe."
"Many new residents think everything east of 99 is dangerous but that’s probably due to a mix of racial ignorance and less damning ignorance."
"West side is safe. East side isn’t so safe."
"In Bakersfield there are small pockets of ghetto, but overall east side is actually pretty cool if you don’t mind leaving the suburbs."
"Union ave on the east side is where all the horrible things happen."
"The east side of Bakersfield is not as bad as people make it out to be."
"Most of the shootings take place anywhere east of Union."
"Stick to west Bakersfield. The eastside has some good neighborhoods, but they’re surrounded in bad ones."
"The actual hoods are cottonwood and some parts of downtown."
"I lived on many areas of the eastside for most of my life. Certain parts can be rough, but not like Los Angeles or Detroit ghetto. You will know you are in a rough part of town when you see it, so there won’t be any surprises."
"Stay west of the 99 if you want to avoid the riff raff."
Is Downtown Bakersfield Safe?
Downtown Bakersfield is safe to visit. You will find a lot of hip bars, restaurants and shops in the area.
Is Bakersfield safe at night?
Bakersfield can be a safe place to visit at night if you avoid going to the eastside of the city and specifically the areas mentioned above.
Is it safe to visit alone?
Bakersfield is a safe place to visit alone. You can mitigate your chances of becoming a victim if you learn the layout of the city, avoid the sketchy areas and follow the safety tips posted below.
Tips To Stay Safe In Bakersfield
Learn the layout of the city. Avoid going to the places where crime is high at nights (eastside).
Don’t leave valuables in your car. Bakersfield has a property crime problem.
Keep your gas tank filled. You don’t want to end up in the wrong part of town at night, searching for a gas station.
Always be aware of your surroundings. Don’t listen to music while waking around town and don’t scroll through your phone mindlessly.
Final Thoughts
Bakersfield is a safe place to visit. It’s violent crime rate is not alarming, however the city does suffers from a property crime problem.
You will be fine in most places in Bakersfield, but you should stay west of the 99 and avoid going to the eastside of the city at night.
Quick Facts About Bakersfield
Fact
Bakersfield, California
United States
Population, Census, April 1, 2020
403,455
331,449,281
Population, Census, April 1, 2010
347,483
308,745,538
White alone, percent
67.7%
76.3%
Black or African American alone, percent
7.6%
13.4%
American Indian and Alaska Native alone, percent
0.9%
1.3%
Asian alone, percent
7.4%
5.9%
Native Hawaiian and Other Pacific Islander alone, percent
0.2%
0.2%
Two or More Races, percent
3.8%
2.8%
Hispanic or Latino, percent
50.2%
18.5%
White alone, not Hispanic or Latino, percent
32.5%
60.1%
Foreign born persons, percent, 2015-2019
18.9%
13.6%
Median value of owner-occupied housing units, 2015-2019
$247,000.00
$217,500.00
Median selected monthly owner costs -with a mortgage, 2015-2019
$1,696.00
$1,595.00
Median gross rent, 2015-2019
$1,104.00
$1,062.00
Language other than English spoken at home, percent of persons age 5 years+, 2015-2019
41.6%
21.6%
High school graduate or higher, percent of persons age 25 years+, 2015-2019
80.1%
88.0%
Bachelor’s degree or higher, percent of persons age 25 years+, 2015-2019
21.9%
32.1%
In civilian labor force, total, percent of population age 16 years+, 2015-2019
63.6%
63.0%
Median household income (in 2019 dollars), 2015-2019
$63,139.00
$62,843.00
Per capita income in past 12 months (in 2019 dollars), 2015-2019
")
")
")
")
")
")
")
")
")
Leave a Reply